Supporting materials accompanying Accenture’s (ACN) latest earnings release point to “‘The New’ — Digital, Cloud, Security Services” as accounting for “More than 60% of revenues” and “experiencing strong double digit growth.” In a stock market obsessed with FAANG stocks and so-called “unicorn” IPOs, what’s not to love about that! As many have learned the hard way, however, sometimes cutting edge talk is supported by the numbers, and sometimes, it’s just talk. With Accenture, the combination of old-time classic fundamentals and technical stock characteristics combine to look good, enough so to suggest this outfit is for real.

© Can Stock Photo / pressmaster
Why Look At Accenture
I rely heavily on stock screening to narrow my focus from the big unwieldy market to a small numbers of stocks for which there are objective indications that they are particularly worthy of attention. Accenture appeared recently in the Chaikin Analytics Bullish Swing Trade screen, which identifies stocks with strong technical and fundamental profiles that present as being short-term “oversold.” Though the name of the screen may conjure images of a quick in-and-out trade, my testing of the screen suggests it presents well even if we assume three-month holding periods.
A 21st Century Consultant-Outsource Firm
Accenture’s basic businesses are hardly new. Management consulting, those so-called outside experts called in to supposedly help senior executives figure out what they should be doing and how they should be doing it, is an age-old activity well known not just to the brass that cuts the checks for the billable hours but also to the rank-and-file who leerily eye the suits and wonder what sort of trouble they’re cooking up. Outsourcing, meanwhile, is now so well established as to have become a Hollywood theme and, lately, inspiration for a political crusade.
But rather than sticking around within the business landscape, these endeavors may actually be moving the forefront, as the still-emerging digitization-automation-robotization of just about everything is pulling us into an economic (and societal) transformation no less and possible more profound than the industrial revolution. Discussion of the socio-political ramifications of all this is for other forums. As to the investment implications, there are many choices such as ETFs dedicated to this theme (see, e.g., the Ark Invest innovation-ETFs product line and many others that pursue the same theme, the multitude of shares of companies offering relevant products and services, and even pre-packaged equity portfolios offered by outfits such as Motif Investing).
For those interested in individual stocks, as the focus of a stake in this area and/or as a supplement to positions taken via ETFs, Accenture stands out for the way it has its fingers in so many aspects of all this.
Here are examples of such activities, as quoted from the transcript of Accenture’s 6/27/19 earnings call:
As one example, we’re helping a leading fashion retailer with a global implementation of SAP S/4HANA that leverages myConcerto, our proprietary AI-powered development platform. myConcerto brings together our deep industry knowledge and differentiated tools and methodologies to help clients innovate and accelerate platform implementation. Our work is driving greater synergies across the retailer’s global brands and building a strong foundation for future growth.
As an example, we’re helping Swisscom, Switzerland’s leading telecom company, transform into a digital service provider. By leveraging our proprietary Digital Omni Channel Platform — with AI, machine learning and analytics — we are increasing the precision and personalization of the customer experience across all their channels.
A good example is our work with Del Monte Foods to unlock innovation and streamline their operations by migrating hundreds of servers and critical SAP enterprise-wide applications to the cloud in less than four months. They are benefiting from a more agile operating environment, real-time customer insights and a 35% reduction in IT costs, freeing up resources to grow the core business.
As interesting as such anecdotal tidbits are, the reality is that they’re just three drops in a nearly $43 billion (in annual revenue) bucket. On what basis might we infer that matters such as these are sufficiently representative of the entire company, or at least the growing parts of it, to warrant accepting a bullish investment case? There can never be a precise answer when we deal, as we must, with the unknowable future. But strong inferences can be drawn from historical fundamental numbers as well as additional data-points consistent with favorable assumptions regarding the future on the part of market participants based on quantitative and qualitative evidence.
The Chaikin Analytics Presentation
Figure 1
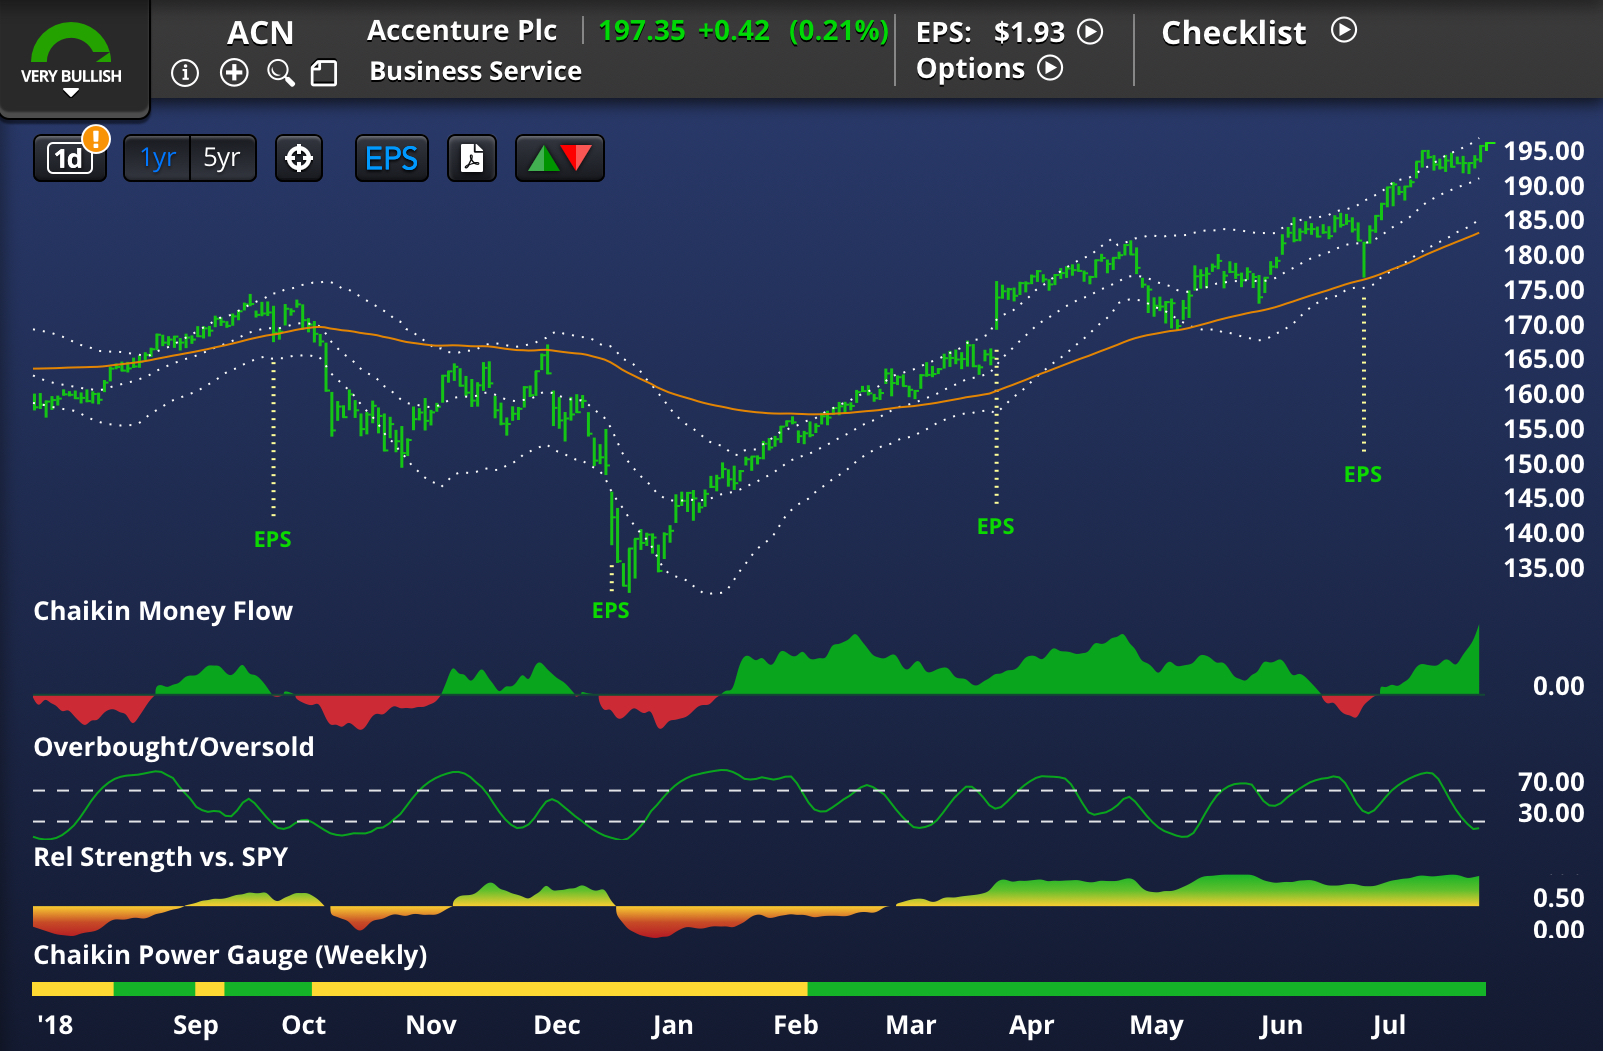
Figure 1 depicts as positive a profile as we’re likely to see. Using our traditional bottom-up reading of the chart, we note:
- A Bullish score in our “technamental” (fundamental + technical) Power Gauge rating (the green in the lowest bar);
- That the rating has been bullish for a while now and that the for the most part, the stock performed well during this bullish-rating period;
- The the stock’s “personality” (its relationship to the S&P 500) is strongly and positively persistent;
- An Overbought/Oversold indicator that suggests the stock is oversold; i.e., possibly making a short-term “trading” trough;
- Very strong Money Flow suggesting strong demand from the market’s big players, and that buyers are more motivated than sellers to complete trades (i.e. stronger volume associated with stronger price movements);
- The stock is above rising trend lines and is bumping against the upper edge of a trading band.
Figure 2, the Chaikin checklist for this stock, which provides a quick summary of the presentation’s salient features, is firing on all cylinders except for overbought/oversold, the short-term oscillator that suggests the stock has started the process of edging its way out of its oversold status.
Figure 2
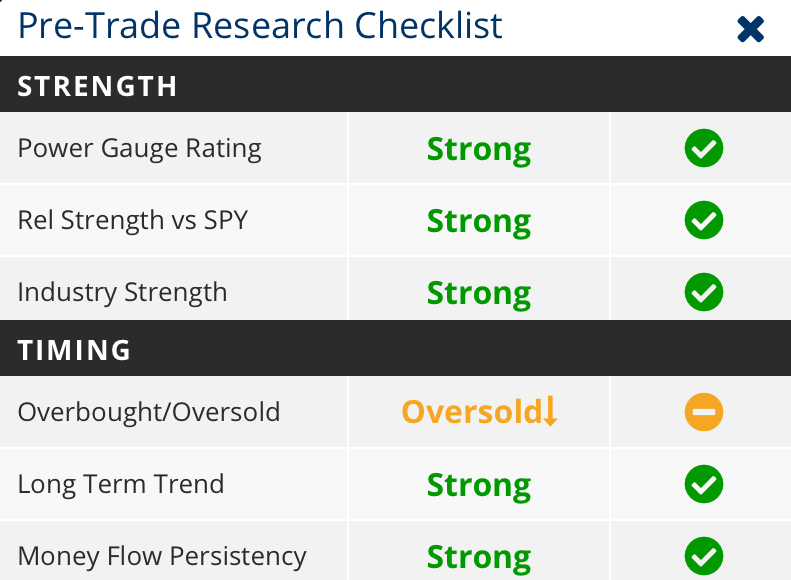
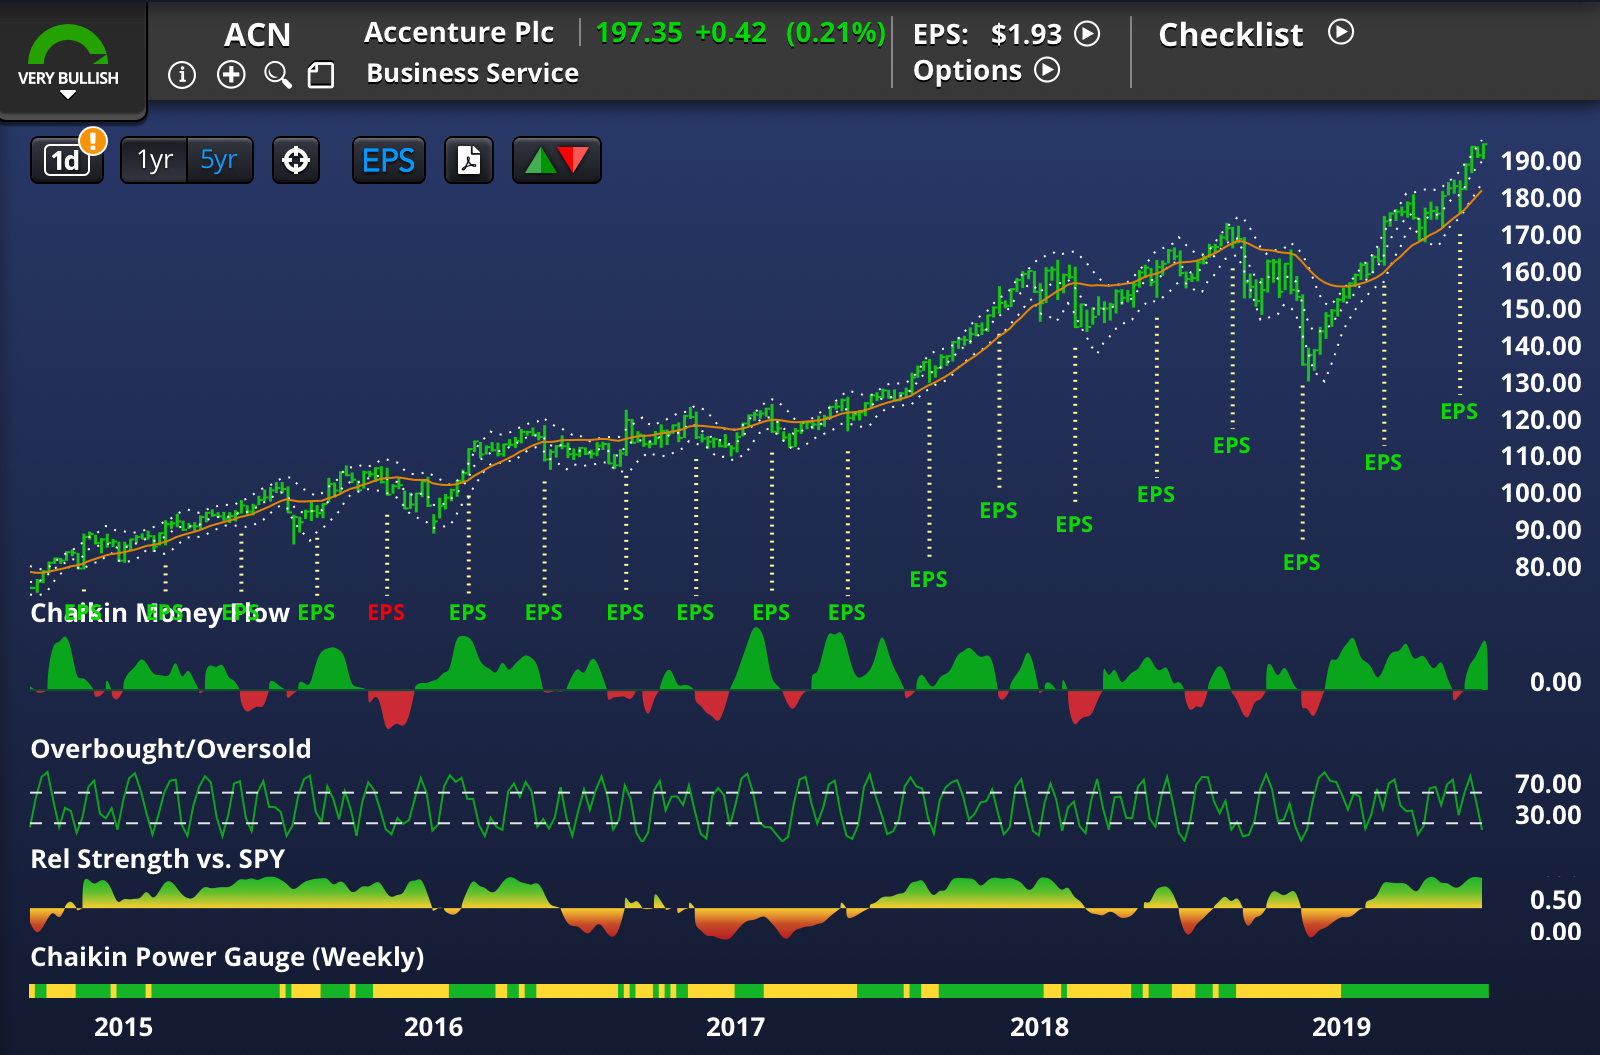
Figure 3, a 5-year view, of the presentation shows that the Power Gauge has not been bearish during the period and that prolonged intervals of a bullish rank, a bullish personality and bullish money flow, such as what we now have, have been accompanied by strength in the stock. In other words, the present situation is not an aberration but an often-recurring phenomenon.
Figure 3
Drilling Down
Being a 20-factor ranking system, Power Gauge provides latitude for stocks/companies to look bad, sometimes very bad, in some respects but exhibit enough strength in certain key respects to pull the overall rank up into bullish territory. This is an important feature since perfection, situations that look good in all respects, are hardly ever, if ever, seen in the real world. We’re always balancing pros and cons.
Figures 4, 5, 6, and 7 below show, however, that Accenture asks very little from us in the way of compromise, less at least than many other situations we’re likely to encounter.
Starting with Earnings, we see that this category, based entirely on historic data, is the weakest area, relatively speaking. It’s not by any means bad relative to the investment universe; it’s neutral. But what we’ve seen thus far might have suggested we should expect more.
Figure 4

Actually, though, I’m fine with this being the weakest area (again, I’m speaking in relative terms). The Street has an unfortunate and often financially-damaging (to investors) habit of assuming that visible growth rates will persist indefinitely. The truth is very different. Growth rates accelerate and decelerate all the time (if you took calculus, think less about growth rates and more about the first derivative of the growth rate function). Super-strong growth is much more likely to falter. I tend to prefer buying into growth rates that have more room to accelerate going forward (the digitization story) particularly when, as here, the Earnings Surprise rank is no less than neutral (suggesting management, when it guides analysts, has a realistic picture of what’s going on out in the field) and when the company is maxing out on the Earnings Consistency rank.
Table 1 provides more color on the growth picture. Revenue growth, as noted, has so far been OK. But even to this point, where “The New” is still in the process of kicking in, we see earnings as having grown more quickly as the company improved margins.
Table 1

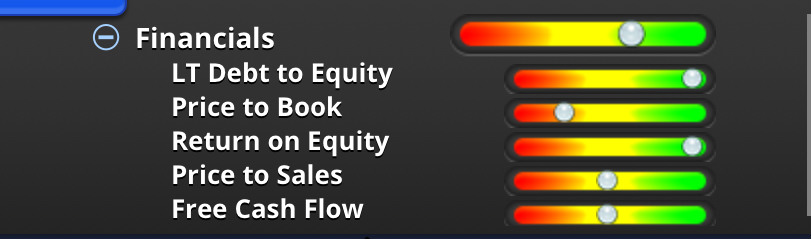
I’m particularly impressed by the extreme bullish ranks for Return on Equity and Long-Term debt, both of which are in the Financials category.
Figure 5
Return on Equity is the penultimate measure of company quality combining margin, turnover and debt leverage.
Accenture’s Return on Equity Score is top of the line. Table 2 shows how extreme (in a good way) Accenture is in this regard.
Table 2

Returns combine turnover and margin, We see, here, that Accenture is find in both respects. (Don’t get too carried away with the gross margin comparisons. Companies vary in terms of how they categorize expense items that could arguably be deemed “cost of goods sold” or “selling, general & administrative expenses.” Difference impact gross margin comps, but. by the times we get down to operating margins, the differences are washed away and the compas are apples-to-apples.
Normally, we would be concerned about trailing-12- month figures that are below 5-year averages; a deceleration. But the numbers are are not normal. They are way, way above normal. In such cases, deceleration is to be expected. Accenture’s returns have a long way to go before we need to worry about them becoming unspectacular.
Anyway, the strong returns are not not just a matter of bragging rights. Return on Equity is an important indicator of the company’s ability to generate growth in the future; it gets a lot of bang for every buck it reinvests.
It’s worth noting that some of this reflects share repurchases that reduce equity (the denominator of the income divided by equity return-on-equity equation. (The company pays dividends, too, so a lot of excess cash flow is being given to shareholders.) Note, though, from Table 5b, that funds for repurchasing are not coming from new debt (in other words, the company is not getting fancy or aggressive with its balance sheet).
Hence the top-position for the Long-Term Debt score.
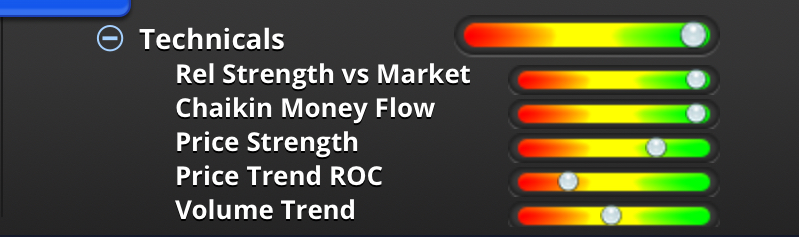
Figures 6 and 7 reflects the behavior of key investment-community constituencies and the market itself.
Figure 6
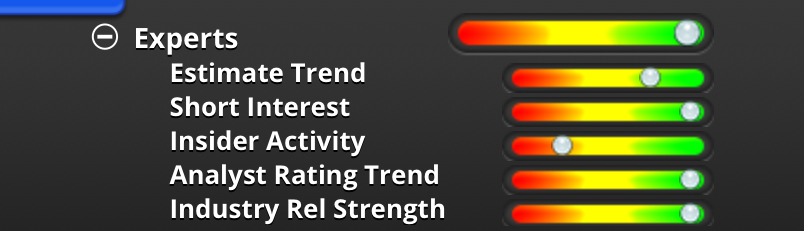
Figure 7
The Analyst Rating score is interesting. It’s actually a contrary indicator. The top score here reflects not a tendency of analysts to fall all over themselves pushing out Strong Buy ratings. It’s the opposite. Analysts have plenty of room to raise ratings and produce the impact such events often produce; mark a high point in the stock’s trajectory.
But with a good estimate revision trend and a strong industry group (being a lone wolf is romantic in many aspects of life, but on Wall Street, the best stocks often run with a big posse in the form of comparably strong peers), it’s not hard to envision analysts finding reasons to boost ratings in the future and, hence, motivate potential buyers to take our shares later on, when we’re done with them.
Meanwhile, the Technicals are fine,
Wrapping Up
Let’s conclude by considering whether, as often happens, potential good news is already baked into the stock in the form of exorbitant valuation ratings.
Amazingly, though, Power Gauge presents no bearish valuation components:
- Price to Sales, Free Cash Flow (a value-related metric) within Financials and Projected P/E in the Earnings category are neutral. This is consistent with the notion of more room to to expand.
- Price to Book (part of the Financials category) is the weakest metric, and even that isn’t a disaster — it straddles the boundary between neutral and negative. Book value has come under some attack lately as not reflecting intellectual property and the like. The measure does include the accounting item “retained earnings” which represents is the accumulated monetization of intellectual property and the like, and growth potential is a factor in determining the appropriate relationship between Price and Book, just as growth is important to evaluating other ratios. And according to financial theory, high P/B and high return on equity go hand in hand. So given Accentures high returns and strong potential for monetizing its asset base (tangible and intangible), I’m OK with this particular Power Gauge score.
Table 3 adds further context.
Table 3

* Click here for more on the P=V+N (Price – Value + Noise) framework.
It reminds us that neutral Power Gauge value-related metrics aren’t subtle code words for bearish. In contrast to Wall Street culture, where a “Hold” analyst rating is often a coded “Sell” message, here, “Neutral” really and truly means “Neutral.” It’s hard to justify running in fright from a price/sales ratio, for example, that is not extreme relative to the S&P 500 median. While the P/E ratios are above those of S&P 500 stocks, they are in line with Industry norms. P/B, the most extreme ratio, was addressed above and in our overall rating, the near-bearish score it gets is overwhelmed by strong scores in the more-growth-oriented factors.
So on the whole, Accenture, despite gains the stock has achieved to date, shapes up as a worthwhile play on the ongoing, and likely to accelerate, digitization of our economy, and it’s available at an acceptable valuation.
