Factors Defined
A factor, in this case, an equity investment (stock) factor, is a presently-observable attribute that is associated with future share returns. The Price/Earnings (P/E) ratio is an example of a factor. Stocks with lowP/Es are widely expected to outperform shares with high P/E ratios. (Factor inversion is present when a factor operates in a manner that is the opposite of what should be anticipated. When shares with high P/E ratios outperform lower P/E stocks, the P/E factor is said to be inverted.)
Articulating Particular Factors
This challenge can be addressed many ways.
Since most share price movements are influenced by general stock-market conditions, the stock market itself (more specifically, the expected return of the equity market) is widely considered to be a factor, and in some quarters (those who believe markets are efficient), the only genuine factor. Most market participants today go further and also consider such things as company size, valuation, company quality, and company investment to be factors. See, for example, the pioneering three-factor schema (consisting of the market, size, and value) proposed in 1993 by Eugene Fama and Kenneth French, their 2015 five-factor expansion (that added profitability and investment), a 2018 critique by David Blitz et. al. chiding them for having failed to include Momentum and Volatility, and if this isn’t enough, research by Guanho Feng, et. al., Jason Hsu, et. al., Soosung Hwang, et. al addressing the proliferation of new factors that now collectively comprise the “Factor Zoo” in order to discern more examples of factors.
What about dividend yield? Is that a factor? Many see this as an attribute of a desirable stock. However researchers argue that it’s not a factor since empirical research demonstrates no relationship between higher dividend yields and greater future share returns. The way Fama and French put it, the increased return from the dividend yield tends to be offset by declining share prices. Critics of yield are correct; higher yield is not associated with expected superior returns, but their research is still wrong.
While they did not err in a computational or statistical sense, their research was simply pointless. Market practitioners know that higher yields exist because share prices are bid down (relative to the level of dividends) due to investor fears that the dividend will be reduced or eliminated (typically due to expected poor company performance). Given this cause and effect, it was never rational to hypothesize an association between high yields and superior future returns. In fact, the more reasonable topic for research is whether lower yield (down to and including zero) is the factor to be positively associated with future equity returns. (Low- and zero-yield companies tend to reinvest profits aiming at internally generated growth.) The error in the yield factor research occurred simply by having undertaken the project. Had empirical study supported the high-yield hypothesis, one would have no choice but to expect computation error, or lucky coincidence.
For convenience, factor investors and researchers tend to speak of factors with reference to a relevant investment style. Hence P/E would be considered a value factor. Other value factors would include price/book, price/sales, price/free cash flow, etc.
Researchers usually define factor with reference to a single idea. For example, Fama and French defined their value factor as Book Value-to-Market, the ratio of a company’s book value to its market capitalization (many practitioners today express the same idea in terms of per-share Price-to-Book (P/B). I think this approach is problematic because it increases the probability that the factor will misrepresent the influence of the attribute. If, for example, a company is losing money or is experiencing a temporary surge in earnings due to a gain on the sale of an asset, P/E (assuming that is the ratio being used to define the factor) would be affected in an inconsistent and non-representative way. Similarly, if a company just made an acquisition that will lead to a big jump in sales going forward, the P/S (which is based on the latest reported figures) would look unrealistically high due to use of an unsustainably small sales tally in the computation.
Hence utilizing single data items that are so easily altered by standard (albeit erratically occurring) business transactions to represent entire factors can be a misleading and risky strategy. I prefer to define a factor as a collection of items (i.e. a portfolio of items). For example, Value is not just defined as P/E or a Price/Book ratio. I define it through six ratios: (1) P/E with earnings based on the last flour reported quarters; (2) P/E with earnings based on the estimate of EPS for the current fiscal year; (3) the P/E to expected growth ratio (PEG); (4) Price/Sales; (5) Price/Free Cash Flow; and (6) Price/Book. Statistically, these six items are likely to be highly correlated with one another when assessed over a large sample. As a result, quants may reject this approach. However, my approach is defensible, as I’m looking for a comprehensive expression of value that is truly relevant to the assessment of an individual stock. Just as the investor uses stock diversification to reduce idiosyncratic risks from a single stock, I use item diversification to reduce idiosyncratic risks from a single item.
My Factor Collection
It’s tempting to use statistical study to identify relevant factors (i.e. item collections). But such “curve fitting” exercises (where we hunt for trends that describe historic relationships between attributes and equity returns) are dangerous in that they do not tell us whether the relationships we observe are rational or coincidental.
Instead I agree with A bona fide quant is one who acts upon the least quoted but perhaps most poignant passage in James O’Shaughnessy’s What Works on Wall Street: “If there is no sound theoretical, economic, or intuitive, common sense reason for the relationship, it’s most likely a chance occurrence.” Wall Street veteran Marc Chaikin puts it another way: Does it pass “the smell test?”
To develop the collection of factor with which I work, I start with the foundational truth that the fair price of a stock is the present value of future cash flows the shareholder expects to receive, progressing through such well established mathematical formulations as the Dividend Discount Model and the Capital Asset Pricing Model, and adapting those ideal formulations to the prediction challenges that bedevil us in the real world, I work my way down to the following framework:
P/E = 1/(R-G), where
- P = Price
- E = Earnings
- G = Expected future growth
- R = Required Rate of Return, which is
R = RF + (ERP * B), where
- RF = Risk-Free Rate of Return
- ERP = Equity Risk Premium
- B = Beta, a measure of company specific risk
(For more detail on the logic behind this, click here for a Strategy Design Cheat Sheet I created to show Portfolio123 users how to use financial logic to develop rules-based stock-selection strategies.)
Market items RF and ERP address asset allocation choices, not stock selection. The latter uses P, E, G and B (the only company-specific item used to compute R). We can re-phrase B in terms of its fundamental source, Q (Quality). Therefore, the goal is to identify and invest in companies for which P/E is not necessarily low, but low relative to G and/or Q. Each of these would, upon rising, exert upward pressure on P/E and vice versa.
Here, then, are the five factors (collections of items) with which I work:
The Relationship Between Price and Earnings (or ome other measure of shareholder wealth)
- Value: This is the most obvious choice, the factor that’s probably used by everybody. It assumes that all else being equal, shares priced lower relative to some measure of shareholder wealth are preferable.
Company-Specific Quality/Risk
- Quality: This refers to such well-known items as margin, turnover, financial strength, and return on invested capital. These are the fundamental drivers of future sales risk (volatility), future earnings risk, future share volatility, and finally, future Beta. I presume higher Quality is associated with probably lower future Beta. As a result, my use of the factor presumes that all else being equal, higher Quality (lower business risk) makes stocks more desirable (supports a higher P/E) than lower Quality.
Expected Future Company Growth
Because this factor cannot be directly observed, it’s assessed through proxies or clues (similar to clues used by police detectives to infer the commission of an act for which no eye-witnesses can be found). I use three categories of proxies:
- Growth (Historical): Consistent with what investors would logically assume, higher Growth is preferable to lower Growth. But this factor, based as it is on data from the past which can’t be assured to have predictive value, is limited. Therefore, I view articulation of the growth factor as more an art than a science. Put another way, I approach growth as if I were a police detective searching among visible clues to the identity of an unseen perpetrator. I use Growth (historical), Momentum, and Sentiment (behavior of Wall Street analysts) as potential clues (proxies) that can help me infer the existence of an event for which there are no eye-witnesses (future growth).
- Momentum: This refers to share-price momentum and is one of two proxy factors I consider to shed light on investment community expectations of future growth. (Note that I define Momentum broadly to include the entire field of Technical Analysis.) This is an important justification for any use of trend-based Momentum by anybody. Suggesting that Stock XYZ outperformed in Period 2 because it showed strong momentum in Period 1 is preposterous. It is, however, very sensible to assume that XYZ outperformed in Period 1 because of the market’s response to Situation A (a new product, enhanced company efficiency, market share gains, etc.) and that because Situation A persisted into Period 2, the stock continued to outperform. Hence use of trend-based Momentum as a factor (higher is better) is tantamount to a bet on persistence (of whatever was driving the stock in the past). On the other hand, Momentum based on oscillation indicators are based on human tendencies to over-react and correct.)In terms of my logical framework, strong Momentum is the functional equivalent of positive investment community expectations regarding future company prospects; i.e., Growth.
- Sentiment: This is the other proxy factor that stands in for Growth. It utilizes such items as analyst estimate revision, analyst recommendations and earnings surprise. Higher scores in my sentiment factor are presumably consistent with better expectations of future growth and hence are preferable for stock selection. This factor makes a unique contribution to the mix in that it incorporates presumably informed human judgement, which from time to time raises issues of trustworthiness, but is still important given our task of looking to future growth, an endeavor that can never be fully quantitative.
Working, in Portfolio123, I express each of these factors as a ranking system through which I score individual stocks (and favor those with higher ranks). For real-world stock selection, I can use a ranking system as part of a screen that narrow a broad universe to a manageable number of potentially interesting candidates (e.g. a rule limiting consideration only to companies with Quality ranks above 90 on a worst-to-best scale of zero to 100) and/or as a basis for sorting the list of candidates in order to identify a manageable number of final selections (e.g. sort the 250 potential candidates using the Quality ranking system and select the best 20). For details of these five ranking systems, click here.
I also tend to compare these style-specific or specialized factors with a generalist multi-purpose model that seeks to address all relevant considerations. The one I typically study is Marc Chaikin’s Power Gauge model.
Studying Factor Performance – Method
I study factor performance by examining historical performance of a variety of ranking systems (i.e. how the best ranked stocks performed, how the second best group performed and so on down to the worst group).This way, I can measure how often and to what extent a factor succeeded or faltered in predicting share performance in a particular period.
I used the Ranking System performance capabilities of Portfolio123 to measure the performance of each factor-oriented ranking system with ranks are calculated against a universe that approximates the Russell 3000 and from which stocks priced below 3 are omitted.
The stocks are sorted from best to worst and divided into five quintiles, or “buckets” and the performance of each bucket is tabulated. The buckets are labeled such that this highest numbered bucket, 5 in this study, is the one that will, if the factor performs as expected, produce the highest level of performance. (Note: For some ratios, such as Value, lower ratios are preferable. The sorting and scoring protocols are such that the best values, the lowest ratios, will produce higher rank scores, thus maintaining consistency across all items.)
Figure 1 is an example of the Portfolio123 output produced from such a test. The colored bars provide a quick visual summary. However, numerical values for each bar are reproduced at the bottom of the Figure. These numerical values are the ones I use for study.
Figure 1
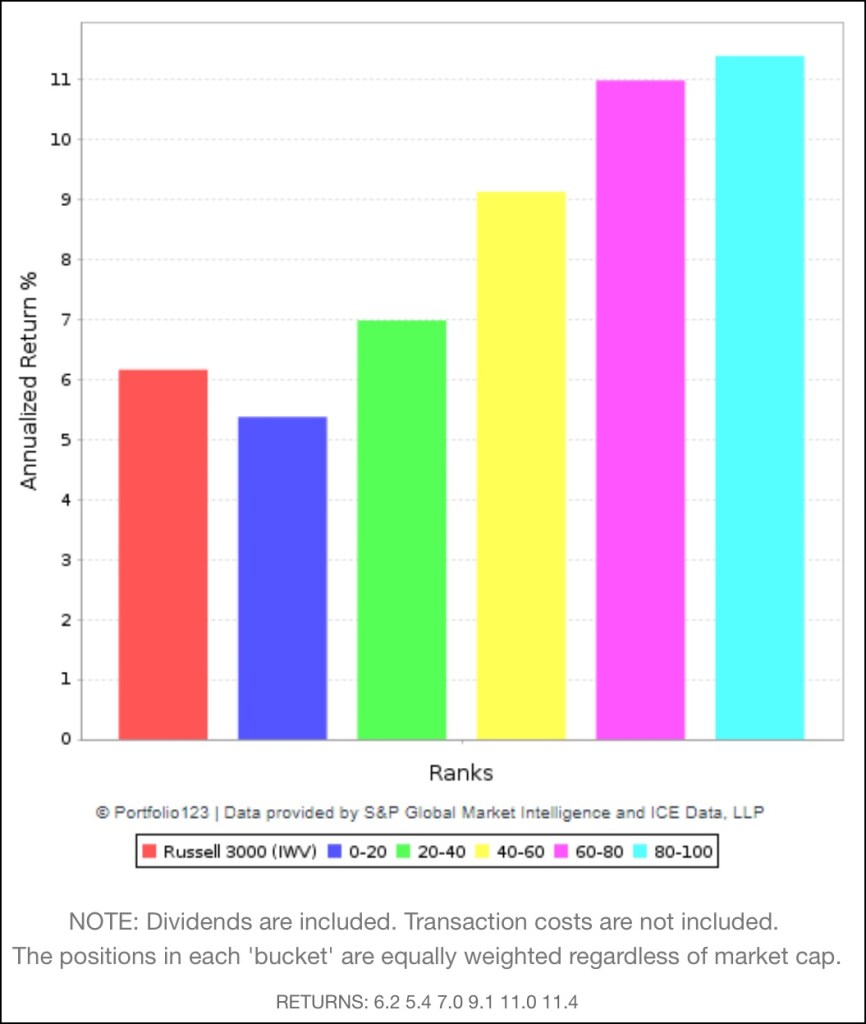
Many studies I do focus primarily on the difference between Bucket 5 (rank scores 80-100) and Bucket 1 (rank scores 0-20). There are labeled in presentations below as “Best – Worst” or “Top – Bottom.”
