PortfolioWise Basic White Paper – The Chaikin ETF Ratings – Jan 2020
PortfolioWise White Paper Digest – The Chaikin ETF Ratings – Jan 2020
Chaikin Analytics ETF rankings are an extension of the firm’s Power Gauge stock ranking system.
The ETF Rankings have three components:
1. Technical Rank
This is based on a submodel which evaluates short, intermediate, and longer-term price strength relative to the whole (not just equities) US-listed ETF universe. It’s biased toward longer-term performance, so ETFs which have been in a year-long uptrend may stay Bullish, even during short-term price drops.
For Equity ETFs,this It reflects more than 50% of the final Rating. For non-equity ETFs it comprises 100% of the rank.Chaikin’s research shows that this component alone, applied to the entire ranking universe, has been successful. That said, more information is available for Equity ETFs, and since this research shows that it enhances the purely Technical Rank, it’s added in where possible though the following two additional components.
2. Average Power Gauge
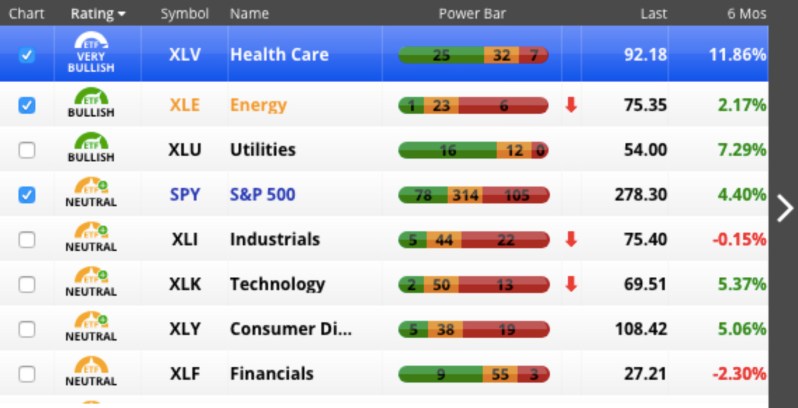
This is a straightforward equal-weighted average Power Gauge Rating of the constituent stocks held by the ETF. A visual picture of the rating distribution within any personal list or ETF portfolio is known on ChaikinAnalytics.com as the “Power Bar,” which presents tallies of stocks within the group that have bullish, neutral or bearish ranks. Figure 1 shows a comparison of Power Bars for several SPDR Sector ETFs.
Figure 1
3. Weighted Average Power Gauge
Here again Chaikin aggregates the Power Gauge ratings of portfolio holdings but this time, the scores are weighted based on the percentage of each position within the overall portfolio. That means ratings for the larger-holdings within the portfolio exert greater influence on the overall scores. (This is not necessarily equivalent to a marke capitalization weighting. If a stock that is 1.5% of the market is weighted 6% in the portfolio, its 6% weighting is what goes into the computation. That said, as a matter of practice, many ETFs choose to weight their positions in a manner that equals or approximates marketcap weighting.)
The Final Score
As is typically the case with multi-factor models, the final score is based on a weighted combination of the scores of the individual components. The specific weightings, above and beyond the disclosure that Technical rank has a more than 50% weighting in the overall Equity EFT scores, are proprietary.
The overall Chaikin Analytics presentation presentation of ETF ranks is illustrated in Figure 2.
Figure 2
Click here for more on Chaikin ETF Rankings
Use of Paired ETF Rankings on Acti-Quant
On occasions when I wish to compare ETF pairs, I do so through a table such as this, which compares Growth to Value.
Table 1
| GROWTH | VALUE | |||
| Overall Chaikin ETF Rank | Neutral | Bullish | ||
| Technical Component | Neutral | Neutral | ||
| # and %’s of stocks in ETF Portfolio with PowerGauge Rantings that are: | ||||
| Bullish | 16 | 3.8% | 71 | 10.3% |
| Neutral | 335 | 79.4% | 495 | 71.7% |
| Bearish | 71 | 16.8% | 124 | 18.0% |
| Impact of Ratings Distributions on ETF Ranks | ||||
| Avg PGR | Neutral | Neutral | ||
| Avg PGR Weighted | Neutral | Bullish | ||
| Growth ETF: iShares Russell 1000 Large Cap Growth (IWF) | ||||
| Value ETF: iShares Russell 1000 Large Cap Value (IWD) | ||||
The overall Chaikin ETF Rank and the Technical Component are the same as those shown in Figure 2.
The Bullish, Neutral ad Bearish rows are taken from the ETF Power Bars. In addition to showing the number of stocks in each category, the table shows the relative percentages. We can therefore see,at a glance, that as of the tine this example was created, IWD, the Value ETF, had a moderately more bullish portfolio when each holding gets equal consideration.
The Avg PGR row, taken from the presentation illustrated in Figure 2, shows, however that the pure “unweighted” Power Bars are neutral for both ETFs.While larger percent of IWD’s positions is rated Bullish, the gap between it and IWF is not large enough in the context of a relative comparison to push its Avg PGR rating above Neutral.
However, the Avg PGR Weighted row is the difference-maker this example. The bullish portion of IWD’s portfolio is top heavy; i.e. its more bullish positions are weighted more heavily within its portfolio than is the case with IWF. Not only is this significant enough to result in a stronger Avg PGR Weighted Score, it’s also significant enough to overcome matching Technical and Avg PGR scores to give IWD the edge in terms of overall rank.
A comparison such as this adds considerable color to what might otherwise be a cookie-cutter assertion that Value currently looks better than Growth.
