Yield Matters
Theorists hate yield. Indeed, the iconic duo, Eugene Fama and Kenneth French, went so far as to deny that yield is a legitimate investment factor (albeit based on what I believe to have been flawed study procedures). Many academically-oriented investors prefer instead to raise cash when needed by selling shares, prices of which many hope will continue to be boosted by share buybacks — assuming Washington (where political optics trumps financial theory) doesn’t eventually clamp down on that. I don’t want to play out this whole never-ending debate here. Instead, I’ll just summarize some key pro-dividend points (even notwithstanding possible tax advantages for capital gains, although less so in the case of “qualified” dividends, which is what most corporate — i.e., non-REIT, non-MLP, dividends are)
- Dividends are more stable than ad hoc share buybacks
- Dividends are a more predictable source of funds than portfolio sales, which may or may not take place after unrealized gains ripen into realized losses (that a decline may be transitory provides no solace for one who needs to raise cash today).
- When it comes to general risk control, there’s something to be said for having a respectable portion of total returns in the form of cash, as opposed to expected capital gains.
- If/when rates do rise in the future, it can help to continually receive a stream of cash that can be reinvested at rising rates, akin to the practice of averaging down. (This represents something of a culture change; for the better part of the past four decades, reinvestment has been occurring at progressively lower rates (averaging up).
Evaluating Dividend Risk – Payout Ratio
The premier measure of dividend risk is the payout ratio, the percent of net income used to fund dividend payments. The lower the ratio, the safer the dividend — so they say.
In my opinion, payout ratio is simplistic, overrated, and often just plain wrong. Here are its main defects:
- Dividends are paid from cash flow, which can vary considerably from net income due to “accruals,” the big ones being depreciation and amortization.
- Reported net income used in payout ratios that can easily be found on financial web sites is often distorted by unusual items, many of which have no present cash impact. So if you absolutely positively must use payout ratio, you’ll need to get the full financial statements, dig into he details, and compute them on your own.
- Different businesses have different cash flow characteristics, with some being better able to support higher net income-based payout ratios than others. Nothing useful is accomplished by insisting that a stable electric utility have the same payout ratio as a hits-driven movie producer.
- Different businesses have different prospects for growth. For many businesses, the last thing we want if for the company to retain a large portion of net profits to be reinvested badly. We’d prefer to see them return excess capital to shareholders (and in my view, with more regularity than is the case with share buybacks).
Evaluating Dividend Risk – Mr. Market
As noted, payout ratio is not a silver bullet dividend-risk assessment tool. It’s not even a good one.
There’s a lot that goes into evaluating dividend risk; cash flows cash needs, stability of the business, growth prospects, etc. Many things can be assessed through the. umbers. Many things require analytic judgment. We can do all this directly, one stock at a time. Or, we can piggyback atop Mr. Market’s assessment.
Yes, Mr .Market. The Mr Market, the very same manic depressive mythical being created by Ben Graham to represent the loser who is always driven by panic to the wrong side of a trade. It makes for a cute story and has been repeated often through the years.
But the long-time classic stature of the myth is it’s undoing in the real world. Mr Market was born at a time when all but the most well-heeled pros had any non-stale facts at their disposal. That’s not where we are now. Snide jokes aside (and there are many of these) the bulk of money in the market today is moved by very smart very well educated people who have all the facts they need at their fingertips. In fact, even individual novices have instant information that would make patrons of the old Library at Alexandria green with envy.

Mr. Market isn’t always right. Nobody is. And in the market, there are always different goals and room for divergent views even among the best and the brightest. But to blithely dismiss Mr. Market as spokesman for the ignorant mob is no longer a sign of discernment. It’s raw cynicism, and for investors, it can turn out to be a very expensive indulgence. This is especially so with the assessment of dividend risk, something, I’ve found Mr. Market to be remarkably good at.
One way to tap Mr. Market’s assessment of dividend risk is to simply look at the yield. A very high yield, a “sucker-yield,” is an extremely useful red flag and I use maximum-yield rules when I create automated models.
Tapping Into Mr. Market Via The Chaikin Power Gauge Rating
The Chaikin Power Gauge rating and approach to chart analysis can be an indirect but potent way to tap into Mr. Market’s insights regarding dividend risk. By not referring specifically to yield, this approach can allow one to search among particularly high yields for situations where certain key suggest less probability of dividend cut and particularly where the stock is acting in a manner suggesting favorable judgments on the part of Mr. Market.
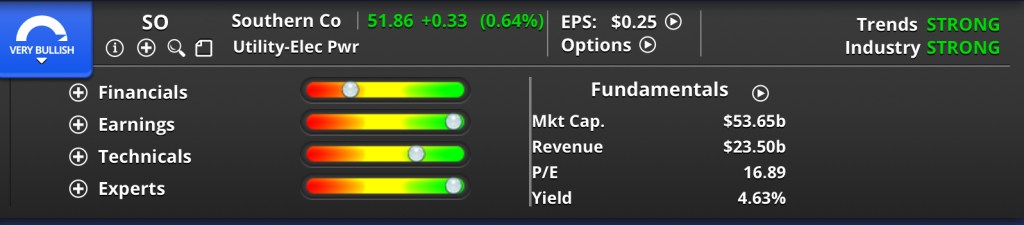
The Power Gauge rating consists of 20 factors grouped into four categories.
- Within the Value (Financial Factors) factor group, companies with strong returns on equity and relatively low long-term debt tend to be favored. Such indications are consistent with the notion of ongoing dividend-paying ability.
- Among the Growth (Earnings Growth) items, strong measures for Earnings Growth (based on performance over the last three to five years), Earnings Trend (earnings percent change over the last 12 months) and earnings consistency are generally consistent with the notion of company conditions consistent with maintenance of existing dividends or the potential for future dividend growth.
- Sentiment (Expert Factors) is a particularly useful measure of dividend risk from Mr. Market’s standpoint. Favorable scores in three of its five factors (Short Interest, where lower is better, Insider Buying, and bullish changes in Analyst Ratings) are logically inconsistent with expectations of impending dividend cuts or eliminations. The other two factors in this group, upward estimate revision and relatively strong industry share performance, suggest business conditions favorable to the maintenance or growth of dividend payments.
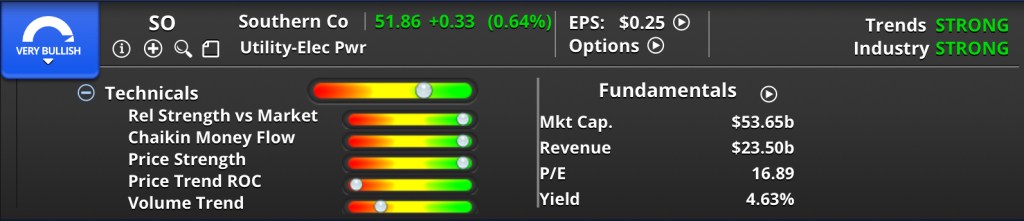
- The Technical (Technical Factors) category is the one through which Mr. Market speaks to us most directly. It concerns itself not with what members of the investment community say, but with what they actually do with real money. However one may wish to interpret positive scores with respect to its five factors (six-month relative share strength versus the market, the Chaikin Money Flow proprietary measure of buying or selling pressure on a stock, the ratio of the stock price to its 200-day double exponentially weighted average, the 42-day change in divergence from the stocks 200-day double exponential average, and the relationship between 30-day and 90-day volume trends), it’s almost inconceivable to imagine a strong overall rating in this category if investors see trouble ahead on the dividend horizon.
There is, of course, no guarantee that any of this is correct when it comes to dividend risk. But if one is going to try to evaluate dividend risk at all, I believe these measures contain far more useful information than the traditional, but simplistic, payout ratio, especially the Sentiment and even more so, the Technical factors.
Tapping Into Mr. Market Via The Chaikin Analytics Charts
Display of the current Power Gauge rating and its historical trend is the first step of a bottom to top approach to reading price charts on chaikinanalytics.com.
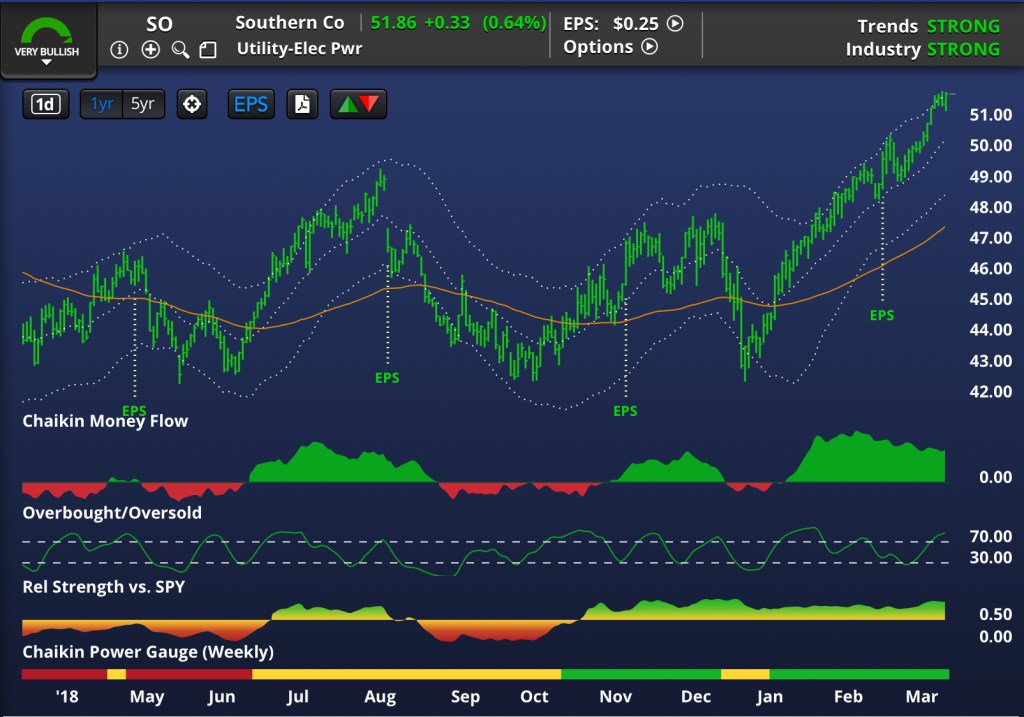
The horizontal bar at the bottom of the chart represents the Power Gauge rating. Details of the Power Gauge can be found in the upper left, where one can click on the rating and open windows that graphically show sub-ratings for each of the four categories. By clicking on a category, one can see, graphically, ratings for each of the five factors included therein.
After considering Power Gauge, one can then continue reading upward to Relative Performance versus the market, the Overbought/Oversold indicator, Money Flow, and the information in the price-plot area. Click here for a more complete discussion on bottom-up Chaikin chart reading.
As with the Technical Power Gauge rank category, it’s hard to imagine favorable messages here when Mr. Market anticipates a cut or reduction in the dividend. (NOTE: Usually, all else being equal, oversold readings tend to be seen as bullish. But when assessing dividend risk, one may prefer to see that a stock is overbought. That said, this is a rapidly fluctuating oscillator that is more useful for timing purchases and sales, as opposed to expressing key opinions of overall investment merit.)
Conclusion
Perhaps the most perplexing challenge today in the field of quantitative investing may be the specter of the crowded trade; i.e., too many investors looking at the same thing and making the same decisions thereby making it increasingly difficult to get into or out of stocks at the favorable levels one envisions. The best way around the crowded trade is, simply, to be creative; to look where the crowd is less likely to be looking.
Mr. Equity Income is just one small and more tradition-bound aspect of Mr. Market as a whole. Given the still-widespread disdain for Mr. Market (Thank you Warren Buffett and other “gurus!”) and ongoing biases in the equity income area that favor fundamentals generally and payout ratios in particular and disdain for anything related to chart reading, technical analysis, and so forth, the approach proposed here has potential to identify relatively uncrowded trades and allow one to climb higher in terms of yield with less risk than the core of the equity income investment community realizes.
