What’s classic in the stock market is dividend income. Really! There was once a time when many institutions refused, as a matter of policy, to consider owning shares of any company that did not pay dividends. What’s new is “smart beta,” and all the talk of fancy portfolio-weighting protocols. The Wisdom Tree High Dividend ETF (DHS) combines both principles. The question is wether all this makes a useful difference in a world with so many ETFs, even equity-income ETFs, from which we can choose. My answer: “Yes.”

© Can Stock Photo / Nejron
Smart Beta: Bigger-Is-Better But With More Thought To Measuring Size
The bigger-is-better notion is endemic in the investment community in more ways than many realize. Consider something like the iShares Micro-Cap ETF (IWC). That’s not big. That’s small, and then some. Bigger-is-better is obviously irrelevant there. Or not. The size threshold is, indeed, pegged to the smaller end of the range of stocks considered for index membership by Russell, but once selected shares are allocated within the portfolio on a“float-adjusted capitalization-weighted” basis.
There are some equal-weighted ETFs out there, and we can go this route even within large-oriented S&P 500. We can choose the Invesco S&P 500 Equal Weight ETF (RSP) in lieu of the conventionally cap-weighted S&P 500 SPDR ETF (SPY) or the iShares Core S&P 500 ETF (IVV). But consider the much greater popularity of bigger-is-better. Even within the already-high S&P 500 collection of stocks, the cap-weighted iShares offering, with $189 billion in assets under management, dwarfs the Invesco equal-weighted version and its AUM of a mere $16 billion. (I’ll leave SPY out of the comparison; it’s beyond big, a world unto itself).
But even after we acknowledge the primacy of bigger-is-better, there remains the question of how we measure size. Market capitalization is the standard, whether in pure form or in the “float adjusted” version. (In the latter, price is multiplied not by number of shares outstanding but by number of shares deemed tradable, thus excluding shares owned by insiders and, in many cases, large institutional blocks deemed unlikely to trade).
Market cap (whichever version one prefers) is important in a world where liquidity matters. The prospect of a $200 billion equally-weighted 100-stock portfolio fund trying to pick up a stake in a $25 million micro-cap is obviously absurd — and impossible. Looking at the market as a whole, we need the predominance of cap weighting to keep things functional. But what’s necessary for the world as a whole is not necessary, or even desirable, for the individual investor or adviser both of who have the advantage of bering able to do what they really think makes sense for their own portfolios or clients without having to worry about causing a global liquidity crisis.
So individual investors and advisers are obviously free to be size-agnostic, or even smaller-is-better, and many do. Yet there is another layer that is often overlooked: There are fundamental benefits to choosing to continuing to think big — even when not compelled by liquidity considerations, to do so. One can start with the notion that for big companies to get big, they have to have something going for them. There are reasons why Apple (AAPL) got huge while early peers-rivals such as Commodore, Tandy and Coleco are largely unknown to pc users without at least some grey hair. There are reasons why Google search by Alphabet (GOOGL) is bigger than Yahoo! (the early leader), Alta Vista, and however many other names I can’t remember.
Beyond the presumptions of business skill that legitimately accompany size alone, there are other quality-risk benefits to size. A huge often under-appreciated one is operating leverage. Bigger companies are better able to cover fixed costs, making their bottom lines less prone to volatility based on fluctuations in sales. And there is the D-word much beloved by investors: Diversification. Bigger companies tend to be more diverse “portfolios” of different kinds of operating units, customer categories, regional exposures, etc. and are less risky than single-line firms much the way a portfolio is less risky than a single stock.
So we’ve sort-of circled back to cap weighting, haven’t we. Perhaps. But there is a drawback here. Because share price figures in the computation, there is an extra momentum-like pull in the direction of the stock’s price movements. When prices rises, a stock’s prominence within the portfolio rises not just because of the price gain, but also because the now greater market cap gives the position a greater allocation within the portfolio. To see further how this works, click here. This extra momentum jolt is much appreciated in bull markets such as what we’ve been enjoying for what seems like ages. But it can get ugly on the other side of the mountain.
Enter “smart beta” or fundamental weighing. This involves allocating within a portfolio based not on market cap but on fundamental size. We could allocate based on sales, or based on net income, or cash flow, or book value or combinations of fundamental factors. They key is to measure size in a way that does not refer to the stock price. So when we talk about a company, a business, big is big and small is small whether we’re in a bull market, bear market, or a sideways market. We’re measuring the business, independent of stock gyrations.
Bigger Dividends Stream Equals Better Company?
Wisdom Tree offers an array of ETFs whose portfolios are fundamentally weighted using, as a basis for weighting (and for measuring size) dividends paid.
We’re not necessarily talking about yield, We’re talking about the total amount of dividends paid by a company without considering the number of shares the dividends are distributed among or the price of those shares.
- Company A pays $10 million in dividends that are allocated among 5 million shares ($2.00 per share) and that its shares are priced at $50, making the yield 4%.
- Company B pays $50 million in dividends that are allocated among 200 million share ($0.25 per share) and that these shares are priced at $15. Making the yield 1.66%
- According to Wisdom Tree’s dividend weighting protocol, B is the much larger company. In a two-stock portfolio consisting of A and B, A will account for 16.7% (since its $10 million dividend stream will account for 16.7% of the $60 million total) while the lion’s share, 83.3% of the allocation will go to B, whose dividend payment totaled 83.3% of the total sum.
This specific example might not impress and income-oriented investor because, whatever the fundamental merits of B relative to A, the portfolio yield is only 2.1%; that’s OK, but its easy to do better.
So if an income-oriented investor is to be interested in Wisdom Tree’s dividend-weighted High Dividend ETF (notice that Wisdom Tree named it High Dividend and not High Yield), we’ll need two things:
- Even though dividend weighting doesn’t automatically assure a good yield, we’ll need to see things work out in the real world such that it turns out this way.
- We’ll also have to buy into the idea that bigger dividend streams make for better companies, at least in terms of what investors look for when they choose to pursue large size.
The first item is pretty clear. The yield for Wisdom Tree High Dividend is 3.37%, which is right in line with, as of this writing, is the same as that of the prominent iShares Select Dividend ETF (DVY), which I often use as a benchmark when doing my own research in the equity-income area.
Meanwhile . . .
With 417 constituents (410 of which have are rated by the Chaikin Power Gauge model), I’d hesitate to say every company is great, but with respect to the portfolio as a whole, a solid case can be made for including it in an equity income portfolio. To put this ETF in perspective, I compare it to the iShares offering as well as to some other prominent equity income ETFs. These are listed in Table 1.
Table 1
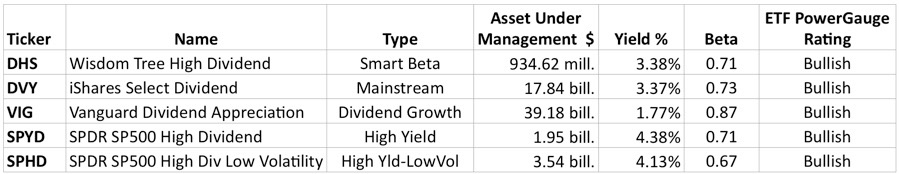
Table 2 evaluates the rank distributions within the portfolios of these funds using the Chaikin Power Gauge rating model, which ranks stocks on the basis of 20 factors divided among four broader categories; Value, Growth, Technicals and Sentiment.
Table 2
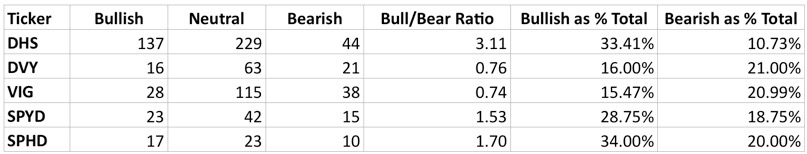
Although weighting is the key to smart beta, Table 2 does not take portfolio weightings into account. It’s actually telling us more about the filter each ETF algorithm uses in order to determine which stocks will be included in the portfolio; i.e., which ones will be subjected to the weighting protocol. We see from the above that Wisdom Tree, simply through its practice of screening a core 3.500-stock universe down to the top 1,500 in terms of dividends paid and then screening the latter group such as to limit eligibility to those whose yields rank in the top 30% accomplishes a lot in terms of collecting “good” stocks.
This raises two interesting questions:
(1) Is there really a relationship between dollars of dividends paid and investment merit?
In the growth-oriented marketplace that took hold in the early 1980s and has remained in place much of the time since, dividends largely receded from the investment community spotlight. But Wisdom Tree’s Global Head of Research, Jeremy Siegel, on page 5 of his report , The Dividends of a Dividend Approach, jogged my memory from the pre-growth era, where failure of a company to pay dividends was actually held in disdain and in many cases, made the stock ineligible for consideration by institutional investors:
- Dividends have theoretical and empirical importance in determining stock values
- Historically, dividends have provided the majority of the stock market’s real return over time
- Dividends provide an objective measure, independent of accounting schemes and management judgment
- Paying dividends indicates that management is focused on increasing shareholder value
- Investors, particularly baby boomers in the developed world, have an increasing long-term demand for income for a new phase of their life: retirement
Of particular importance is the fourth bullet point, the the one related to shareholder value While I certainly do not intend to demean companies that re-invest heavily for future growth, the reality is that many, if not most or all, Wall Street veterans have seen too many instances in which the reality of productive growth-facilitating reinvestment has fallen far shy of before-the-fact PowerPoint expressions of strategic vision. This is why Peter Lynch famously translated corporate “diversification” to “deworsification,” why during my decade or so as a Conglomerates analyst back around the 1980sI was constantly writing about lackluster returns on equity and the special situation opportunities that repeatedly arose as conglomerates (the premier advocates of not returning profits to shareholders) decided, one after another, to de-conglomerate, why shares of companies that announce acquisitions often fall immediately after the announcement, and why we see so many corporate writeoffs (to adjust balance sheets for the true worth of unsuccessful ventures, some internal and some that came in via M&A). And there’s something to be said for companies that opt for dividends as opposed to share buybacks. Dividends tend to be regular and predictable, forcing management to be more disciplined, while share buybacks are opportunistic thus leaving management free to refrain from making purchases when they don’t feel like making them.
So yes, a case can be made that companies that pay a lot in dividends are arguably better. I also vaguely remember doing a project in grad school (back in the late ‘70s) that demonstrated positive links between high dividend payout ratios and superior risk-adjusted share performance. And as more and more investors reach the age when current income becomes more important than pursuit of unicorns, we may well see more interest in and empirical research on this topic.
(2) Shouldn’t we worry about Wisdom Tree’s focus on the top 30% in terms of yield since high yield is usually associated with poor fundamentals and elevated risk of dividend reduction or elimination?
That’s a legitimate concern and one I take very seriously. When I screen for income stocks, I not only set a criteria relating to minimum desired yield, but I also set criteria for maximum desired yield. I have repeatedly seen, anecdotally and empirically, that very high yields are associated with poor relative total-return performance due to dividend reductions or fears of reduction. I’ve seen this so much as to conclude that Mr. Market, the mythological manic-depressive trader invented by Ben Graham and popularized by Warren Buffett who is supposedly wrong all the time is actually remarkably skilled at evaluating dividend risk. Very high yield is, indeed, a valid danger signal.
But here’s the good news: When I worry about yields that are so high as to raise serious red flags, I’m talking about yields in the top 2% or 5% (depending on how I define a particular dividend-payer universe). By working with the top 30%, Wisdom Tree has plenty of good opportunities available for this ETF’s portfolio. And the fact that its yield (which necessarily derives from the yields of the stocks it owns) matches that of the flagship iShares yield fund suggests Mr. Market is just fine with the (dividend weighted) risks Wisdom Tree is taking.
A Role For Wisdom Tree’s High Dividend ETF In An Equity Income Portfolio
Some interesting differences among ETFs becomes evident when we compare sector allocations, as we do in Table 3. (Note: These are based on 9/30/19 portfolios as compiled by S&P Global Market Intelligence and sector breakdowns reflect S&P’s GICS schema. Data in Siegel’s report come from FactSet, which has a different sector schema, so don’t expect perfect matches.)
Table 3
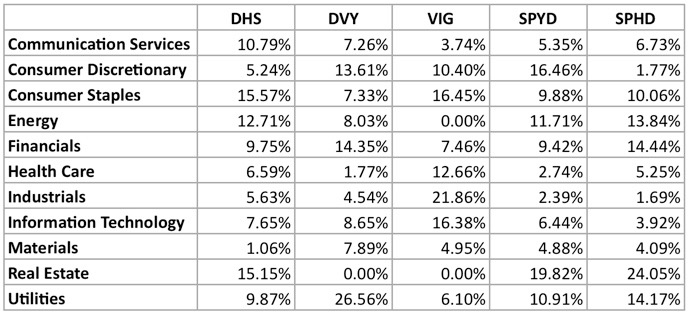
Relative to the iShares DVY ETF, the Wisdom Tree DHS is “underweight” in utilities, a traditionally important sector in the equity income arena. On the other hand, DHS has strong concentrations in Energy and Real Estate. DVY also has more exposure to Financials.
Energy remains out of favor so investors could rightfully wonder about DHS’ concentration there. Actually, though, just two stocks, Chevron (CVX) and Exxon Mobil (XOM) accounted for 59.5% of DHS’ energy exposure. Their yields had percentile rankings (relative to Russell 3000 dividend payers) of 79 and 86 respectively, well below my worry threshold of 95. The only Energy stocks in DHS with yields above the 95 worry threshold are Taga Resources (TRGP) and Semgroup (SEMG), at 97 and 98 respectively. These issues combined to comprise just 2.7% of DHS’a Energy weighting and 0.3% of the overall ETF.
DHS has a strong stake in Real Estate, mainly REITs. These have long appealed to income seekers and they have been hot this year. There are 141 stocks in this category and none comprise more than 5.4% of the Real Estate allocation (0.8% of the ETF as a whole). Among the larger Real Estate positions, all have yield percentiles below 85 except for Iron Mountain (IRM) and Sabra Health Care REIT (SBRA) both with borderline percentile ranks of 95. The overall 154-issue real estate is well diversified across all sub-segments of the REIT area.
On the whole, I see no more dividend-security risk to DHS than DVY, and the identical yields suggest this applies in the aggregate to full portfolios.
DHS looks interesting in its own right as a stand-along equity-investing selection. Beyond that, though, it might make for an intriguing pairing with either DVY or VIG:
Table 4
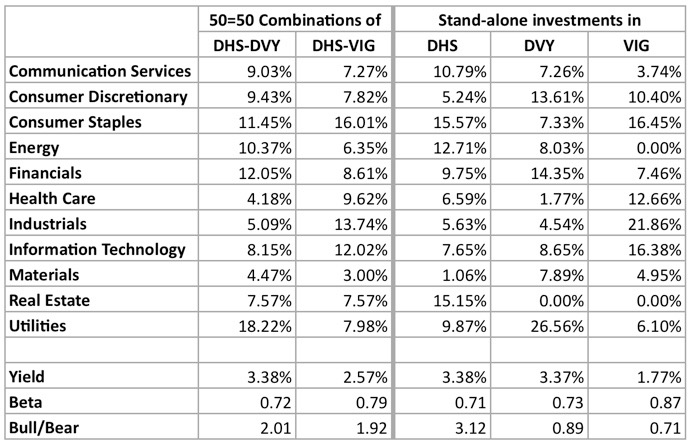
Given the smart-beta weighting scheme (which could lag bull markets but outperform bad markets, due to the absence of market cap’s shadow momentum effect), the well-ranked (according to Power Gauge) DHS portfolio, the way the DHS sector allocations would add sector balance to standalone stakes in DVY or VIG, DHS appears a potentially beneficial accompaniment to either of those extremely popular equity income ETFs.
