If you think equity income investing is too conservative, grounded, stable, solid etc, to consider such things a technical chart analysis or sentiment analysis, think again. With interests rates and dividend yields remaining — still —at or near historically meagre levels, investors who want or need current income can’t afford to ignore cues from what to many might seem to be out-of-character sources — the market itself.

© Can Stock Photo / phuchit
Stereotypically, the typical equity-income investor is seen as a stogy sort, someone who frets if a dividend payout ratio (the percent of net income paid out as dividends) rises above, say 40% or if debt winds up accounting for more than half of a company’s capital. This is understandable; maintenance of the dividend is of primary concern and, hopefully, opportunities to benefit from dividend growth. But such investors don’t need the sort of hyper-growth “real” stock-market players seek.
They’re not looking for the next Amazon (AMZN) or Alphabet (GOOGL) and have no interest in debating when, if ever, Uber (UBER) or Lyft (LYFT) can achieve global dominance. Finding the next “Dividend Aristocrat” (blue-chip companies that have increased their dividends for 25+ years) seems a more appropriate goal; the next Colgate Palmolive (CL) or the next Sherwin Williams (SHW). But as great as it sounds to invest in Dividend Aristocrats, Colgate Palmolive’s yield today is a bit below 2.5% while Sherwin Williams’ is just a hair above 1%.
Sure there are many better yields available. The yield for Game Stop (GME) is nearly 20%. But do you really think Mr. Market is going to hand you a free lunch like that? This would be a great income play if, if, if, if the company continues to pay its $0.38 per quarter dividend. But is that a reasonable expectation for a company whose bottom line has gone into the red, whose sales are shrinking and which continues to face the existential challenge of a product that has gone virtual as opposed to the physical cartridge-based games on which it once grew rich and famous. A reason why the yield is so high is because the stock is down, as the investment community fears the slicing or elimination of the dividend.
Evaluating Dividend Risk
So how can investors know that a yield such as what we see on GameStop is highly insecure?
- There is no meaningful trailing-12 month payout ratio because net income was negative during the period.
- The 5-year average payout ratio was 158%, which is awful; it means the amount of money paid as dividends was well in excess of net income.
But simple rule-of-thumb analysis does not always give the right answer.
- Depreciation, a non-cash expense, had a lot to do with the recent red ink and prior periods of poor net income. So as a percent of cash flow, dividends over the past five years consumed only 28% of Cash from Operations.
- Debt is not excessive; the trailing 12 month interest coverage ratio is 5.53, which is better than the 4.56 Specialty Retail median.
- Th existential crisis may even be manageable; maybe you wont keep getting your dividend forever, but maybe the company can be liquidated in a way that gives you a profit on the shares you buy at today’s depressed prices, or maybe the shares will go up if the company buys back stock.
You Can Put Your Head Into The Mouth Of The Bear
Even for what seems to be a no-brainer, there really is a lot to think about — if you want to go it alone. That’s fine if you like to do this sort of thing, and many do and profit handsomely. Many others lose their shirts. This sort of thing requires a lot of skill and hard work. But please, if you do it, make sure this is really in line with your skill set, and the effort you are able to bring to bear (pun semi intended).

© Can Stock Photo / aragami12345
You’d be flying into a rough headwind because with situations like these, history has shown there’s been a lot more heartache than happiness. I did two simple — very simple — 20-year backtests on Portfolio123. One assumed purchase of stocks yielding more than 15%. The other assumed purchase of stocks yielding less than 8%.
- The high-yielding portfolio (more than 15%) produced an annualized average return of minus 10.2%.
- The lesser yielding portfolio (less than 8%) produced an annualized average return of plus 8.8%.
What about standard deviation, beta, controlling for non-dividend stocks . . . Don’t even bother. There are some things in life that are so obvious they are not even worthwhile subjects for research. The proposition that very high yielding stocks are troublesome because the bad scenario, the reduction or elimination of the dividend, happens with much greater frequency is close to, if not actually being, something known is a court of law as a matter for “judicial notice” (a fact that can be accepted as true even without the introduction of any evidence).
So again, you can dig into the GameStops of the world if you want. Just understand what you’d be getting yourself into. You may win on this one, but watch that you don’t lose out on the next 20 or so such situations.
The Better Way — Get Help
It’s exciting and romantic to be a lone wolf and if you are, there’s a better chance of getting your life story made into a Hollywood movie. But there’s something to be said for accepting help when it’s available.

© Can Stock Photo / Pakhnyushchyy
There was once a time when you’d also be better positioned in the stock market because the typical investor was an information-deprived simpleton who could readily be outwit by smarter traders who sought objective facts and obtained them in a timely manner. That’s the setting under which the famous Ben Graham myth concerning“Mr. Market,” the proverbial manic depressive who always wants to buy high and sell low, was invented.
That’s not the world in which we live today. Besides the danger of very high yields, I think we can also take judicial notice of the proposition that even newbie investors have free or cost-effective and almost instantaneous access to all the information they need to make sensible investment choices. If Mr. Market is wrong today, it’s not because he was negligent or ignorant. It’s because he made reasonable assumptions that didn’t pan out or because his reward-risk goals differ from yours (meaning he may ultimately be proven right — unlike novels or theatrical productions, investment stories never end, meaning there’s always another chapter, starting every business day at 9:30 AM New York time).
In this world, it’s safer to at least give Mr. Market the benefit of the doubt. While the Ben Graham myth treats him as presumed guilty until proven innocent, today, we’d be better off treating him as presumed innocent until proven guilty.
Getting Help with GameStop
It takes me only a few seconds to decide not to touch GameStop and its nearly-20% yield.
A yield that’s so incredibly high relative to what else is available in today’s marketplace puts me on notice, right at the outset, that most in the investment community are pessimistic about income-seeker profit opportunities.
With this particular stock, I could stop right here. But Mr. Market’s message won’t always be so easy to discern or assess. Suppose I’m looking at a yield of, say, 5%, still well above average, but not so high as to make the headwind unsurmountable. A 20-year Portfolio123 backtest of yields in the 4%-6% range shows an annualized return of 9.48%. Still some 6%-ers may depict stocks about to rise, meaning that yields will fall. Others may be stocks on the downtrend with a yield of 6% potentially on a path toward 15%. So we need more.
Figure 1, the ChaikinAnalytics.com presentation of GameStop, gives us lots of extra help.
Figure 1 – Chaikin Analytics Presentation of GameStop
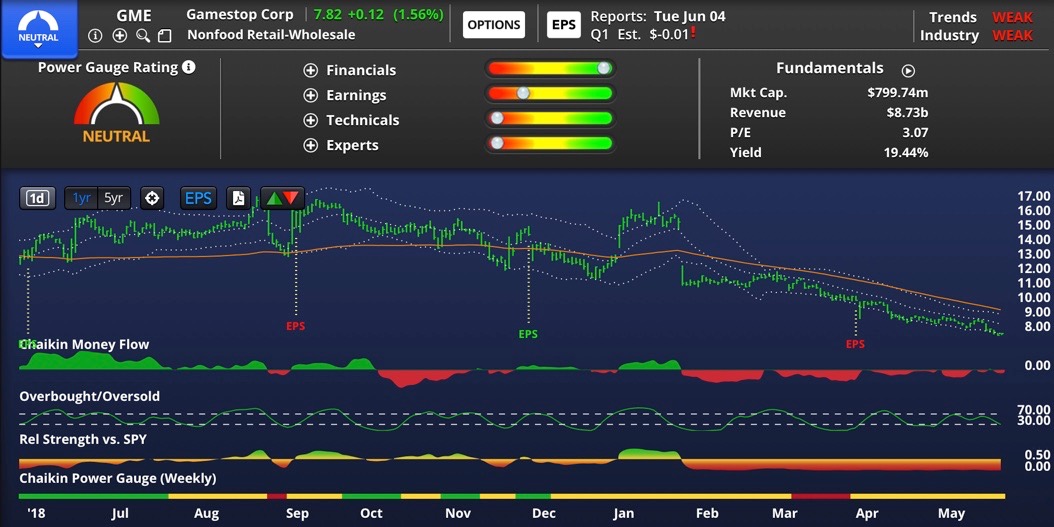
The overall PowerGauge rating is neutral. This is a 20-factor model covering the full range of fundamental and market-related factors.
The overall rating is neutral. Are you surprised it’s not bearish? Remember our basic dividend-security inquiry: There are two sides to interpretation of finances.
But we see here that Mr. Market is delivering two very-strongly worded “Run Far, and run fast” messages to the dividend crowd. These are in the sub-ranks for Technicals and Experts. Figures 2 and 3 drill down into these sub-ranks.
Figure 2 – Details of Experts PowerGauge Sub-Rank
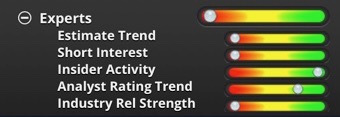
Figure 3 – Details of Technicals PowerGauge Sub-Rank
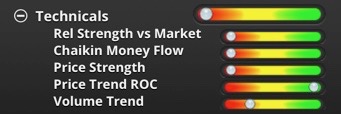
Not all of these 10 factors point in the same direction. That’s fine. they rarely do.
But relative to most breakdowns, the Technical profile here is one of the worst I’ve seen. The only silver lining, if we can call it that, is that the relationship between the current current price and a trend indicator used here that is not pulling the rank down. But it’s not as if any trends are looking good.
As to the Experts category, Insider trading (buying) is pointing in a bullish direction. That’s not surprising in a situation like this, where share buybacks or liquidation may be on the table. But as an income seeker, I’d need a lot more than this – A LOT MORE — to persuade me to go against all the other negative indicators. The analyst rating factor is pointing bullish but this more likely reflects the extreme nature of this situation. The factor measures the 4-week change in analyst rating and is used as a contrary indicator. So normally, when analysts are getting bearish, PowerGauge is being pushed in a bullish direction. For GameStop, analysts are getting more bearish. If this were a single-factor model, it might persuade us to buy GameStop. But the benefit of a multi-factor model is that nothing stands in isolation (just like life and human thought process). There are enough other bearish indicators here to suggest that this is not the place to lean against the analysts.
Putting the Experts and Technicals sub-ranks together, we have a lot of brainpower giving this situation a thumbs down. “Experts” measures the thoughts of key investment community constituencies. “Technicals” measures what the investment community as a whole has actually been doing.
Flipping The Script — Using Mr. Market To Uncover Bullish Opportunities
I focused on GameStop because of the attention-getting value of a yield as high as what we see and the way it illustrates how market factors can point us in the direction of a sound investment choice without our having to go deep into the weeds of 10-Ks, 10-Qs, and so forth, how we need not debate the merits of [payout ratios based on net income verus free cash flow, etc.
We can use the same process in the other direction, the show us how to find buying opportunities.
Figure 4 shows us the chart for Coca Cola (KO).
Figure 4 – Chaikin Analytics Presentation of Coca Cola
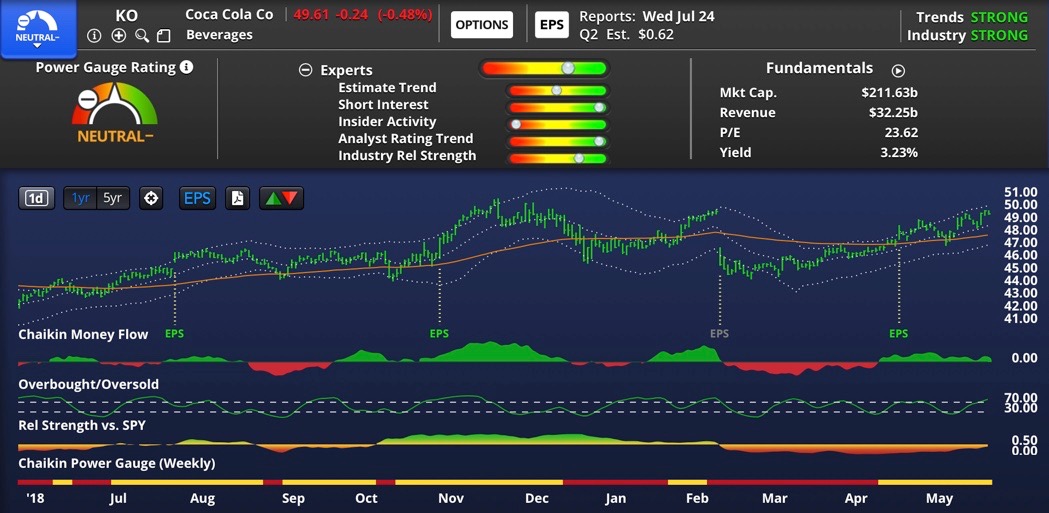
The Experts and Technicals sub-ranks are pointing favorably toward this equity income opportunity.
But is it high-value advice?
The yield, 3.23% is mainstream by today’s equity income standards. So we’re being told that this is OK, perfectly fine as part of a dividend portfolio (indeed, it is a dividend aristocrat and a popular holding among equity-income investors). The neutral overall rating suggests we not expect anything more here.
There are two things we can do to get an extra edge.
- Look to the Technicals and Experts sub-ranks for bullish signals where the yield is too high to qualify as an easy no-brainer, and/or
- Look to the overall PowerGauge rank for a signal that a mundane yielder may have something extra going for it.
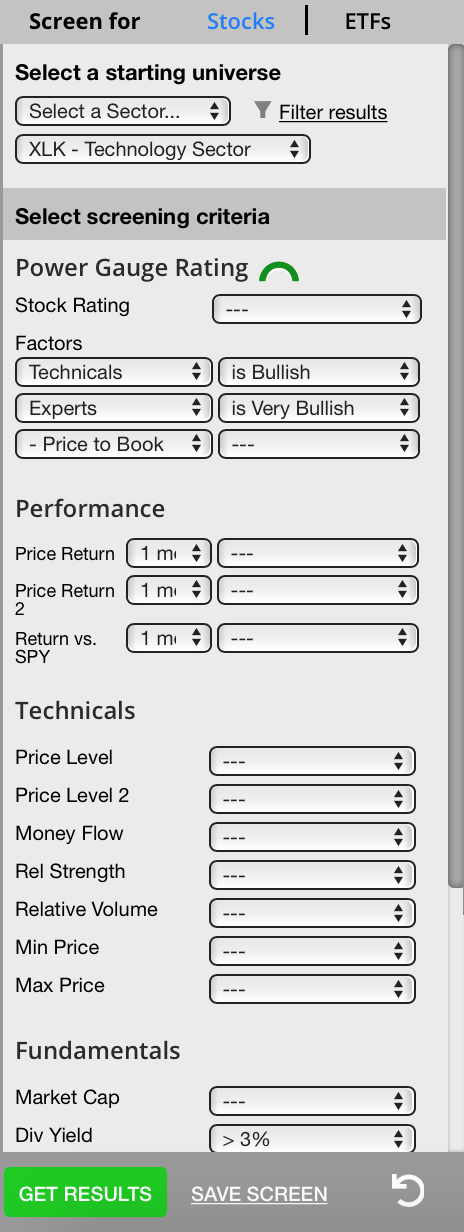
To do this, I used the Chaikin Analytics screener to search for stocks yielding above 3%, a rank of Bullish or better for the Technicals sub-category of Power Gauge rank and a rank of Very Bullish for the Experts sub-category. I then cycled through each of sectors and chose to skip Finance and Real Estate (yield-rich areas that will be addressed in a separate post).
Figure 5 – Screen Settings
I then went through the results looking for yields that were high (but not high enough to be considered junk yields). Here’;s what I came up with:
- Abbvie (ABBV), 5.35% yield
- Chevron (CVX), 4.01% yield
- IBM (IBM), 4.90% yield
- AT&T (T), 6.32% yield
Then, I went through the list looking for shares with more ordinary equity-income yields, but in this case, bullish or veery bullish scores on the overall PowerGauge rank (i.e. stocks that in addition to the screen-requirement of strength in the Experts and Technicals categories, also fared reasonably in terms of the other categories, Earnings and Financials). That uncovered these stocks:
- American Electric Power (AEP), 3.04% yield
- Gilead Sciences (GILD), 3.77% yield
- Target (TGT), 3.14% yield

3 thoughts