Value investors today’s momentum-driven stock market can’t just look for low ratios. We need ratios that are low among a list pre-qualified to include only bona fide growth plays. Shares of building supply distributor HD Supply (HDS), after having shaken off its M&A-private-equity driven youth, now fills the bill as the company now takes aim at the fragmented but growing market for maintenance of residential, hospitality and health care facilities.
Why this Stock is Being Considered
It’s important, before you start to read about or evaluate a stock, to know why the it came under consideration and be comfortable soundness of those reasons. HD Supply Holdings (HDS), got into my radar as a result of the Goldilocks Value screen I created on Portfolio123 that looks for stocks with relatively low valuation metrics but only from a universe that has been prequalified to include situations benefitting from the strong momentum Mr. Market cherishes nowadays. Details of the approach are described in a 6/27/18 blog post.
A Different Kind of Value Stock
At first glance, buildings-supplies distributor HD doesn’t look like any sort of value stock at all.
Table 1
| HDS | Medians | |||
| Industry | Sector | S&P 500 | ||
| PE using TTM EPS | 41.64 | 17.76 | 22.19 | 22.15 |
| PE using Est CurYr EPS | 13.29 | 16.39 | 18.52 | 18.10 |
| PE using Est Nxt Yr EPS | 13.30 | 14.65 | 15.58 | 16.45 |
| Price/Sales | 1.51 | 1.01 | 1.31 | 2.66 |
| Ent. Val./Sales | 1.89 | 1.34 | 1.51 | 3.25 |
| Price/Free Cash Flow | 21.10 | 26.98 | 31.16 | 31.91 |
| Price/Book | 5.38 | 1.97 | 2.61 | 3.37 |
| Noise as % Mkt. Cap. * | 46.94 | 47.33 | 58.23 | 54.61 |
| * Click here further information about the concept of P=V+N (Price = Value + Noise) | ||||
Don’t freak out over the Trailing 12 Months P/E; that’s influenced by unusual items that impacted recent results, something that occurs often and makes trailing 12 month P/Es the least useful in my opinion. Price/Book is likewise a bit of an oddity, due to the way the company’s history impacted its equity tally (see below). The other items, the ones that paint a more normal picture, are OK on balance, but nothing special.
What is interesting is the screen that pre-qualified the list of stocks I ranked as possible value candidates. As noted above and explained when I introduced the screen, the list is limited to companies about which the Street is optimistic.
Table 2, which shows the recent trend of estimate revisions, tells us that analysts have become more optimistic about upcoming prospects; not spectacularly so by any means, but enough so to bring HD out of the great “all else being equal” that would be needed if we were to suggest that lower valuation ratios per se are always for the best.
Table 2
| EPS Estimates % Changes | HDS | Medians | ||
| Industry | Sector | S&P 500 | ||
| Cur Year Est 4 week Chg | 0.000 | 0.000 | 0.000 | 0.152 |
| Cur Year Est 8 week Chg | 0.308 | 0.447 | 0.060 | 0.298 |
| Cur Year Est 13 week Chg | 2.741 | 2.787 | 0.273 | 0.597 |
| Next Yr Est 4 week Chg | 0.000 | 0.000 | 0.000 | 0.171 |
| Next Yr Est 8 week Chg | 0.330 | 0.444 | 0.000 | 0.207 |
| Next Yr Est 13 week Chg | 2.566 | 1.152 | 0.626 | 0.400 |
| Data from S&P Compustat via Portfolio123.com and reflects Compustat standardization protocols, TTM = Trailing 12 Months, MRQ = Most Recent Quarter | ||||
Table 3 shows indications of how the investment community (not the analysts, but those who do the actual buying and selling of shares) feel about HD.
Table 3
| HDS | Medians | |||
| Industry | Sector | S&P 500 | ||
| Share Pr % Ch – 1 Wk | 0.159 | 0.661 | 0.000 | 0.724 |
| Share Pr % Ch – 4 Wk | 0.091 | 1.471 | 1.194 | 2.008 |
| Share Pr % Ch – 12 Wk | 10.456 | 1.101 | 2.398 | 4.743 |
| Share Pr % Ch – 26 Wk | 13.268 | 1.598 | -0.155 | 1.167 |
| Share Pr % Ch – 52 Wk | 36.886 | 23.513 | 13.155 | 12.513 |
| Short Int % Float | 1.917 | 4.196 | 2.343 | 2.370 |
| Short Int Days 2 Cover | 3.265 | 4.968 | 4.072 | 3.303 |
| 5D SMA as % above 20D SMA | -1.384 | 0.284 | 0.463 | 0.696 |
| 20D SMA as % above 50D SMA | 1.426 | -0.188 | 0.123 | 1.279 |
| 50D SMA as % above 200D SMA | 10.530 | 3.946 | 1.159 | 1.862 |
| 5D EMA as % above 20D EMA | -0.182 | 0.270 | 0.521 | 0.919 |
| 20D EMA as % above 50D EMA | 1.604 | 0.175 | 0.377 | 1.117 |
| 50D EMA as % above 200D EMA | 7.844 | 4.397 | 1.976 | 2.714 |
| Data from Portfolio123; D = Days SMA = Simple Moving Average; EMA = Exponential Moving Average (in which recent data is more heavily weighted). | ||||
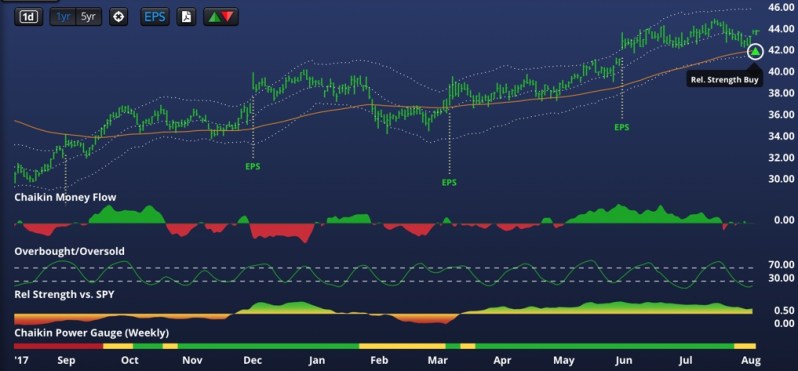
Short Interest, as a percent of the float and as expressed in terms of how many days it would take for short sellers to cover their positions at recent levels of trading volume, is slightly below those of peers. Key technical indicators, however, as well as recent share price performance data, suggest HD has been in favor among buyers.
Interestingly, however, Table 3 also shows that the stock has taken something of a breather in recent weeks. But this sort of cooling off, or consolidation if you’re into that terminology, is not a bad thing. Nothing moves in a straight line, up or down. The nature of this stock’s pause in the context of its recent strength generates a “Relative Strength Buy” at Chaikin Analytics.
What Is It That The Street Likes?
For one thing, although it lacks the glamor of FANG, this company is in a nice business, a boring business, but a nice business; it distributes building-related “stuff” to two segments, Facilities Maintenance, and Construction/Industrial.
Construction and Industrial is the segment where HDS gets to supply big-time projects, an endeavor that can flesh out its CV.
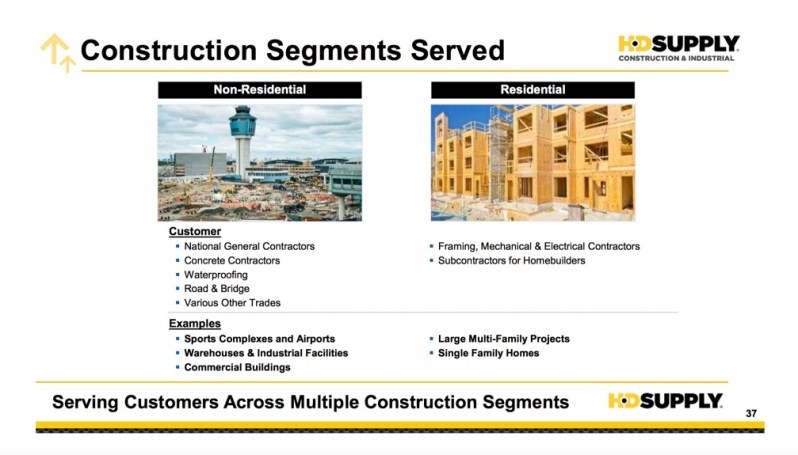
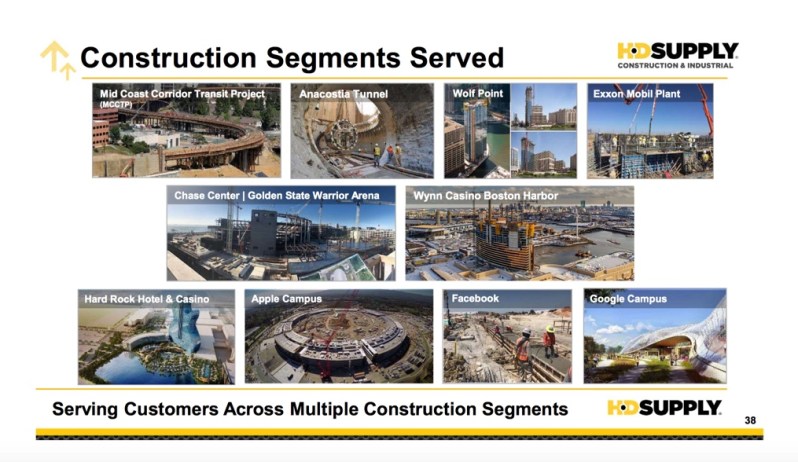
(From HD Supply 2018 Investor Day Presentation)
This is an area being hit by the Trump trade war. Steel rebar, an important product for this group (10% of division sales and 5% of company sales), has seen costs rise due to tariffs only some of which were passed on to customers. But its not as if HD is the only company being impacted; if this situation gets really bad, it will become a market-wide phenomenon. Meanwhile HD is focusing its nonresidential construction efforts on just the 15 largest metropolitan areas in North America. A year ago, there was a gap in activity as large projects wound down. But lately, the gap has been filling with large new multi-year projects. So tariff pressure aside (or at least as aside as we can think of it), the fundamentals of this business look healthy; the market is expected to grow at a low-to-mid single digit annual rate with HD potentially adding to its share of this fragmented industry.
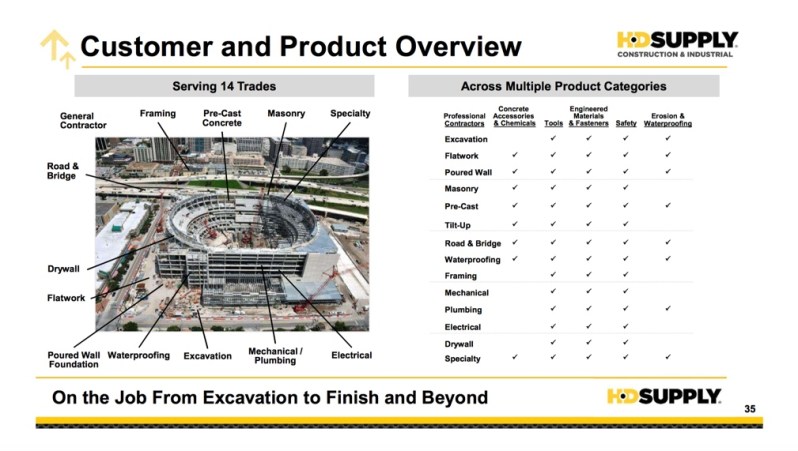
Facilities Maintenance is the slightly larger division in terms of current Sales (55% of total) but it fetches higher EBITDA margins and (18% versus 10% for Construction/Industrial). More interestingly, management asserts that the future growth opportunity is much bigger for Facilities Maintenance.
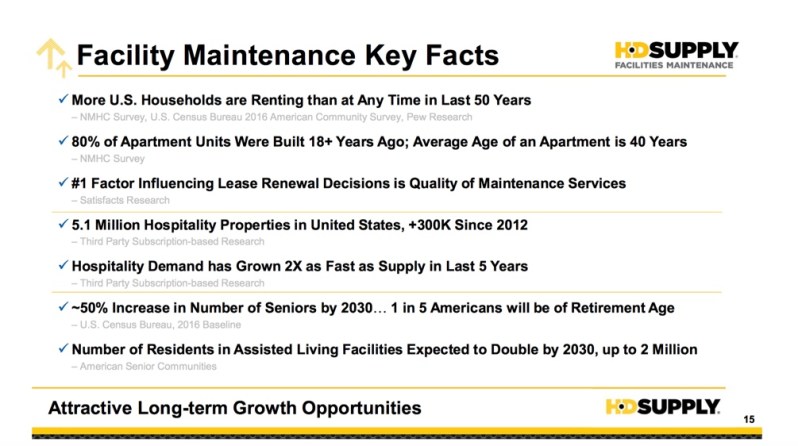
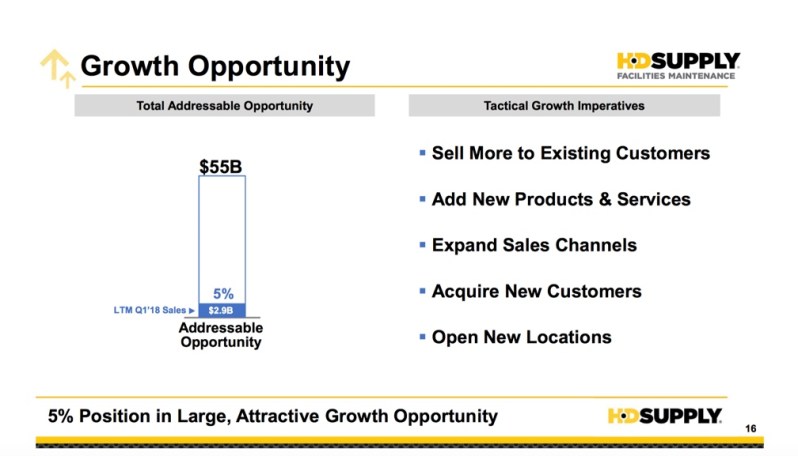

(From HD Supply 2018 Investor Day Presentation)
This is the part of HD I find especially attractive. As buildings built in the past boom age, more maintenance is needed, and when maintenance is needed, it can’t be seriously deferred. Multifamily Residential facilities are big for HD (65% of group sales) and the easiest way for a real estate pro to botch an investment in such properties is to get sluggish in basic maintenance. Ask any property manager, superintendent, or even landlord-tenant attorney how important it is to attend to things. And, by the way, a lot more people are renting nowadays than in the past, which means more buildings, more aging, and more needs. As to Hospitality (19% of group sales), the need to keep properties spic and span and fully functional is obvious since managers know full well how quickly pictures and stories of flaws will go up on Yelp, Trip Advisor, etc. Healthcare (senior living facilities) is the smallest part of the group now (8% of sales), but it needs to be pretty-much hotel-like to attract and retain residents (and keep regulators from getting nasty). As the population ages, this could be a very strong growth opportunity for HD.
So that’s the business. It’s boring but that’s good.
- “The perfect stock would be attached to the perfect company, and the perfect company has to be engaged in a perfectly simple business, and the perfectly simple business ought to have a perfectly boring name. The more boring it is, the better” Peter Lynch, One Up on Wall Street, Kindle loc. 1944
- “I get even more excited when a company with a boring name also does something boring.” Peter Lynch, One Up on Wall Street, Kindle loc. 1957
HD checks both of those boxes. And by the way, this isn’t just a sentimental or folksy thing. In financial terms, boring means more stable or more predictable; less angst. This may not seem important in the FANG era, but we’ve started to see what can happen when FANGs get cavities (see, g.g. Facebook). You may not be a customer of HD. You may not debate the merits of its offerings on chat boards, etc. You my not Tweet about it. You may never have read an Instagram post about it. You may not even care whether any building in which you enter are were built or are maintained with the help of HD. But stock ownership is not about any of that. Its about the combination of potential return and risk and when we talk like this, HD starts to take on some of our kind of glamor.
Note, though, that even HD isn’t perfectly free from worry. It started integrating a big acquisition last winter and got slammed by adverse weather trends. Labor costs are rising. So, too, is the cost of transportation. But no business is free from worries like these. (We have a name for baggage-free securities: risk-free short-term Treasuries.) Relative to the equity market as a whole, I put HD very low on the scale of worry.
The Numbers
As context for considering the numbers, it’s important to understand that HD, the entity as it stands today, has not had nearly as long a history as the business has. It was cobbled together over the course of the late 1990s and early 2000s under the auspices of Home Depot, the parent of the company’s former operating subsidiaries. Skipping the multitudinous details (all of which you can find in the 10-K if you have a masochistic streak), the business was conveyed to private equity interests in 2007 and eventually sent off into the public markets via IPO in 2013.
Often, entities that go through the private-equity-M&A wringer don’t get much TLC in terms of their operations and HD is no exception. It had its work cut out for it when it gained its independence.But it did at least have three things going for it; a good business as discussed above), a management team determined to improve operations, and a lot of tax loss carry-forwards (which finally end next year) to put extra cash at the company’s disposal. So HD streamlined its operations and improved its balance sheet, so much so, that it is now able to put share repurchases on the menu of things it may do with cash flows, along with internal growth and tuck-in acquisitions, as opportunities present themselves.
Table 4
| The key Inflows: | Important Outflows | Surplus | |||
| Cash Fr. Oper. | Dividend | CapEx | Acquisitions | ||
| 2012 | -681 | 0 | 115 | 248 | -1044 |
| 2013 | -367 | 0 | 131 | -3 | -495 |
| 2014 | 295 | 0 | 119 | 0 | 176 |
| 2015 | 422 | 0 | 86 | 0 | 336 |
| 2016 | 513 | 0 | 81 | 0 | 432 |
| 2017 | 502 | 0 | 94 | 0 | 408 |
| TTM | 469 | 0 | 89 | 362 | 18 |
| Data from S&P Compustat via Portfolio123.com and reflects Compustat standardization protocols, TTM = Trailing 12 Months, MRQ = Most Recent Quarter | |||||
Table 5
| $ mill. | mill. | |||
| ST Debt | LT Debt | Equity | # Shares | |
| 2012 | 899 | 6,430 | -1,591 | 201 |
| 2013 | 10 | 5,534 | -764 | 201 |
| 2014 | 34 | 5,140 | -760 | 203 |
| 2015 | 9 | 4,302 | 744 | 189 |
| 2016 | 14 | 3,798 | 960 | 186 |
| 2017 | 11 | 2,176 | 1,466 | 184 |
| MRQ | 98 | 2,087 | 1,491 | 184 |
| Data from S&P Compustat via Portfolio123.com and reflects Compustat standardization protocols, TTM = Trailing 12 Months, MRQ = Most Recent Quarter | ||||
As we can see from Tables 4 and 5, diminution of obsession with investment bankers and M&A lawyers combined with tax loss carry-forwards enabled this entity to generate a good amount of free cash flow and that it was put to good use. The balance sheet is now healthy and M&A, still on the agenda, is less frenetic and more operationally-enhancing as well as affordable than in the past, as with the deal done earlier this fiscal year. Expiration of the tax benefits will lead to a less charmed surplus-cash-flow era. But now that HD has become a normal healthy business, that’s okay; we can live with normal cash flows.
Against this context, we can consider Table 6, which summarizes the company’s current fundamental profile.
Table 6
| HDS | Medians | |||
| Industry | Sector | S&P 500 | ||
| % Gross Margin — TTM | 39.80 | 29.24 | 30.52 | 41.64 |
| % Gross Margin — 5Y Avg | 30.74 | 30.74 | 30.76 | 40.10 |
| % Oper. Margin — TTM | 12.15 | 5.87 | 8.20 | 17.54 |
| % Oper. Margin — 5Y Avg | 14.48 | 5.69 | 8.65 | 17.52 |
| Asset Turnover — TTM | 1.08 | 1.52 | 0.87 | 0.52 |
| Asset Turnover — 5Y Avg | 0.9 | 1.34 | 0.85 | 0.45 |
| Inventory Turn — TTM | 4.52 | 5.41 | 5.14 | 5.40 |
| Inventory Turn — 5Y Avg | 4.32 | 4.9 | 4.89 | 5.29 |
| Quick Ratio – PYQ | 2.15 | 2.21 | 1.84 | 1.40 |
| Current Ratio – MRQ | 1.16 | 1.19 | 1.31 | 1.08 |
| TotDebt to Eq MRQ | 1.47 | 1.29 | 0.67 | 0.83 |
| LTDebt to Eq MRQ | 1.40 | 1.03 | 0.59 | 0.73 |
| Interest Coverage – TTM | 4.26 | 2.47 | 5.59 | 7.41 |
| % Return on Assets – TTM | 3.82 | 4.11 | 4.63 | 5.48 |
| % Return on Assets – 5Y Avg. | 3.05 | 2.81 | 4.13 | 5.35 |
| % Return on Equity – TTM | 15.15 | 14.21 | 11.08 | 15.44 |
| % Return on Equity – 5Y Avg. | N/A | 9.99 | 10.33 | 14.38 |
| Data from S&P Compustat via Portfolio123.com and reflects Compustat standardization protocols, TTM = Trailing 12 Months, MRQ = Most Recent Quarter | ||||
Don’t get euphoric over the margin peer comparisons. In terms of industry, HD is being compared in the Table to distributors in general. Within its own field of distribution, however, the company considers its margins too low and still in need of improvement. The more notable comparisons for, us, therefore, are the time series trends, the trailing 12 months versus the five-year average. Those, we see, are going in the right direction. The balance-sheet related industry comparisons are a snooze, and given HD’s history, that is something about which investors should feel happy.
Conclusion
Given where HD Supply has been, what it evolved from and how it did so, where the company stands now, and where it seems likely to go, particularly in Facilities Maintenance, the Street’s favorable view makes sense. The valuation ratios are not outstanding compared to the investment universe as a whole, but they are good relative to shares of the kinds of companies favored in today’s momentum-driven market. Hence the stock is a bona fide 2018 value play.
