Stocks with low tallies for P/E and other traditional valuation ratios are a dime a dozen. Lately, though, Mr. Market has been unimpressed. It’s not that value is dead (it isn’t). It’s that Mr. Market prefers to get a good price on shares of a good company, rather than a dog. Defense IT contractor CACI International is an example of the sort of value stocks that can work today.

Why this Stock is Being Considered
It’s important, before you start to read about or evaluate a stock, to know why the it came under consideration and be comfortable soundness of those reasons. CACI International (CACI), got into my radar as a result of the Goldilocks Value screen I created on Portfolio123 that looks for stocks with relatively low valuation metrics but only from a universe that has been prequalified to include situations benefitting from the strong momentum Mr. Market cherishes nowadays. Details of the approach are described in a 6/27/18 blog post.
A 21st Century Defense Contractor
As then-President Obama reminded Republican challenger Mitt Romney during one of their 2012 election debates, defense spending is not a monolith. At one point in time, we produced many of a certain gizmo about which Mr. Romney criticized reduced current spending. But it wasn’t a matter of the US armed forces suddenly turning dovish or having such a stance politically imposed upon it. It was about changing technology, changing styles of warfare, changing needs, those, according to Obama, being the reasons why production of bayonets is also way down.
CACI is a defense contractor whose offerings, in terms of relevance to contemporary warfare, are as close to 180 degrees opposite of bayonets as one can get. Actually, CACI isn’t a weapons company at all; its an IT (Information Technology) company that derived 65% of fiscal 2017 revenue from the U.S. military (29% comes from civilian government agencies and the balance from commercial clients).
CACI doesn’t blow things up. Its focused on communicating information; secure transmission of information in authorized ways, detection and prevention of unauthorized information movement, and organizing information. There are many headlines and narratives today that while not dealing per se with CACI, demonstrate the importance of proper, secure, transmission and protraction of information. See, e.g., all things Facebook, all things Russia, etc. And in your spare time, check the Bill Clinton-William Patterson fiction collaboration The President Is Missing which, while exaggerated (I hope) for literary purposes still portrays the seriousness of cyber-warfare/terrorism.
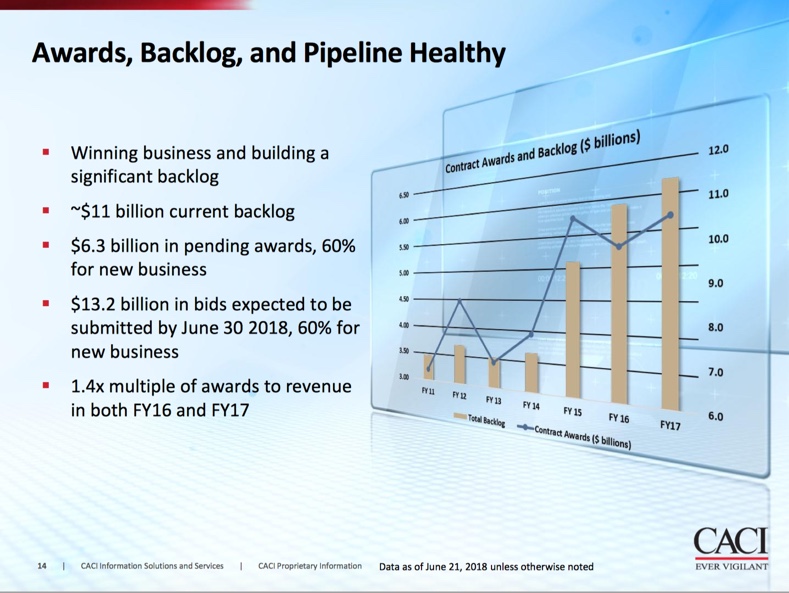
Here is a summary of CACI’s business exposures:
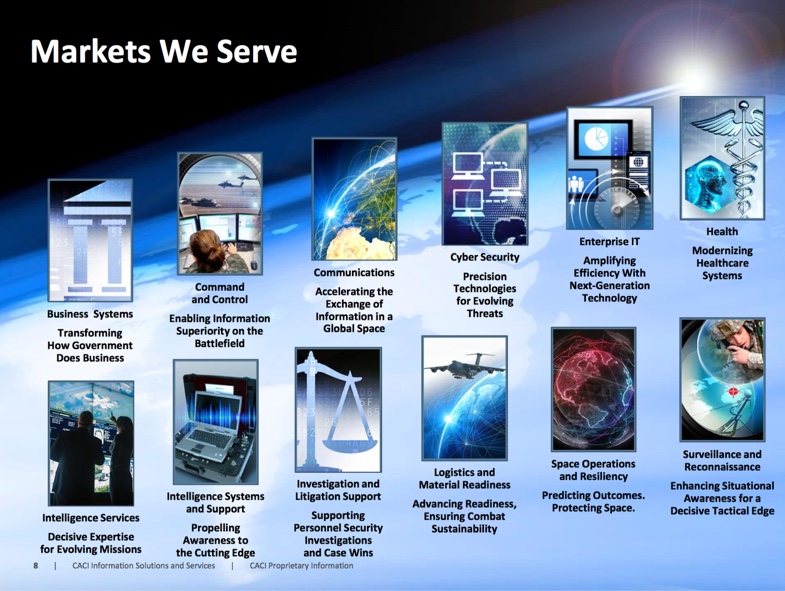 (From CACI’s June 2018 Investor Update)
Business Trends
Life is rarely simple. If we could assume needs would translate to revenues and profits for companies that satisfy those needs, CACI would not likely to have made it into any kind of value screen.
Besides competition (the usual thing that impacts everybody), the big obstacle that stands between CACI and business nirvana is the 2011 Budget Control Act of 2011. Skipping the gory details, all of which have been well publicized elsewhere (including CACI’s 10-K document, pages 7-8), it translates to a big-time political squeeze on defense spending. It hasn’t been the same every year (there have been some relaxations that boosted CACI’s revenues in the fiscal years ended 6/16 and 6/17) but for us at this point in time and looking ahead, we need to assume a stingy spending environment.
Tables 1 and 2 break down CACI’s current revenue and EPS guidance.
Table 1: Revenue Guidance
| $ mill. | Totals | Components of Expected 2019 Change | % change from prior year |
| 2017 Actual | $4,355 | 16.3% | |
| 2018 Estimate | $4,450 | 2.2% | |
| + 2018 new wins and on-contract growth | $300 | ||
| + 2019 New Business | $300 | ||
| – runoff due to program lifescylce | $470 | ||
| + 2019 Acquistions | $70 | ||
| 2019 Estimate | $4,650 | 4.5% |
(From CACI 6/18 Investor Presentation)
Table 2: EPS Guidance
| EPS | Headline Figures | Unusuals | % change from prior year |
| 2017 Actual | $6.53 | 13.4% | |
| 2018 Starting Point | $11.64 | ||
| – 2018 non-recurring credit | $2.66 | ||
| 2018 Estimate | $8.98 | 37.5% | |
| 2019 Estimate | $9.14 | 1.8% |
(From CACI 6/18 Investor Presentation; EPS Guidance figures are midpoints of ranges provided by company)
CACI’s ability to deliver on Revenue and EPS expectations in the current climate will depend on external factors relating to the desirability and prioritizing on the sorts of services CACI provides and its ability to bid successfully and strategically and manage costs.
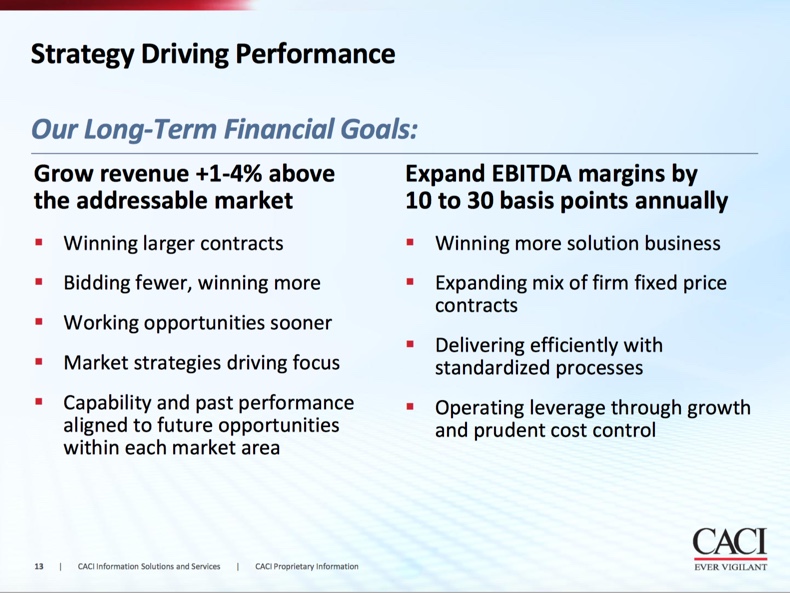
(From CACI’s June 2018 Investor Update)
Is it do-able? On paper, absolutely. In real life, well . . . what can we say. Most, if not all, companies tend to talk about themselves in such terms. For us, investors in the public securities markets and in many cases, not privy to defense department gossip (and who knows how reliable that would be anyway), our best course of action is to consider CACI’s fundamental track record, which either is or isn’t consistent with the way the company portrays itself, and the stock’s valuation relative to same.
The Fundamental Track Record
Table 3 summarizes CACI’s core fundamentals and compares them to Industry, Sector and S%P 500 Medians.
Table 3
| CACI | Medians | |||
| Industry | Sector | S&P 500 | ||
| % Gross Margin — TTM | 33.16 | 37.37 | 55.47 | 41.64 |
| % Gross Margin — 5Y Avg | 32.59 | 36.10 | 54.30 | 40.10 |
| % Oper. Margin — TTM | 7.63 | 10.16 | 3.72 | 17.45 |
| % Oper. Margin — 5Y Avg | 7.33 | 11.25 | 4.49 | 17.52 |
| Asset Turnover — TTM | 1.12 | 0.84 | 0.77 | 0.52 |
| Asset Turnover — 5Y Avg | 0.95 | 0.7 | 0.61 | 0.45 |
| Quick Ratio – PYQ | 1.52 | 1.42 | 1.99 | 1.40 |
| TotDebt to Eq MRQ | 0.53 | 0.60 | 0.14 | 0.82 |
| LTDebt to Eq MRQ | 0.48 | 0.47 | 0.06 | 0.72 |
| Interest Coverage – TTM | 7.60 | 5.91 | 3.29 | 7.41 |
| % Return on Assets – TTM | 7.40 | 4.44 | 0.74 | 5.49 |
| % Return on Assets – 5Y Avg. | 4.57 | 4.29 | 1.83 | 5.35 |
| % Return on Equity – TTM | 15.47 | 12.51 | 2.74 | 15.40 |
| % Return on Equity – 5Y Avg. | 10.23 | 12.54 | 4.62 | 14.38 |
| Data from S&P Compustat via Portfolio123.com and reflects Compustat standardization protocols, TTM = Trailing 12 Months, MRQ = Most Recent Quarter | ||||
That’s a pretty good picture. CACI is not above-par in margins, but it need not be. It’s the combination of margin and turnover (picture it as a distinction between high-margin and low volume versus low margin and high volume) that counts. The two are combined in returns on assets (which show how much the company earned on all the assets at its disposal) and returns on equity (which show how much the firm earned only on shareholder capital; the latter can be boosted by borrowing). Returns were decent over the past five-years, but have looked better of late. We also see that CACI’s balance sheet is a bit on the conservative side of average.
Table 4 shows the trends in key inflows and outflows.
Table 4
| The key Inflows: | Important Outflows | Surplus | |||
| Cash Fr. Oper. | Dividend | CapEx | Acquisitions | ||
| 2011 | 226 | 0 | 14 | 133 | 79 |
| 2012 | 267 | 0 | 18 | 186 | 63 |
| 2013 | 249 | 0 | 15 | 107 | 127 |
| 2014 | 199 | 0 | 15 | 839 | -655 |
| 2015 | 223 | 0 | 17 | 15 | 191 |
| 2016 | 243 | 0 | 21 | 588 | -366 |
| 2017 | 281 | 0 | 43 | 7 | 231 |
| TTM | 319 | 0 | 40 | 52 | 227 |
| Data from S&P Compustat via Portfolio123.com and reflects Compustat standardization protocols, TTM = Trailing 12 Months, MRQ = Most Recent Quarter | |||||
Obviously, anyone would want to see positive surpluses year in and year out and as a result, dream of big dividends and/or share buybacks. That’s not what CACI is about. CACI’s surpluses are very much positive before we take acquisitions into account. But ultimately, acquisitions do count. CACI is a company that, rather than returning capital to shareholders, is continuing to reinvest in the business by acquiring.
Acquiring can be good or bad, depending, of course, on how well conceived and integrated the purchases are. The bad news is that we, as non-insiders, can’t dive into the nitty gritty of this sort of thing. The good news is that good clues can be extracted from the financials; these are summarized in Table 5.
Table 5
| Annual Surplus from Key Items | Key Period-End Ratios | ||||
| DbtTot2Eq | Interest Cov. | % Ret Assets | % Ret Equity | ||
| 2011 | 79 | 0.31 | 10.10 | 6.32 | 11.64 |
| 2012 | 63 | 0.46 | 11.61 | 7.14 | 13.56 |
| 2013 | 127 | 0.49 | 9.85 | 6.26 | 12.82 |
| 2014 | -655 | 0.94 | 6.86 | 4.66 | 10.56 |
| 2015 | 191 | 0.72 | 6.64 | 3.84 | 8.90 |
| 2016 | -366 | 0.91 | 6.74 | 3.95 | 9.25 |
| 2017 | 231 | 0.69 | 6.10 | 4.14 | 9.63 |
| TTM | 227 | 0.53 | 9.96 | 7.40 | 15.47 |
| Data from S&P Compustat via Portfolio123.com and reflects Compustat standardization protocols, TTM = Trailing 12 Months, MRQ = Most Recent Quarter | |||||
If CACI were doing a bad job of acquiring, if it was guilty of what Peter Lynch famously referred to as “diworsification” (diversification that makes the company worse), we’d see it in all or some of columns 2 through 5 of Table 5. We’d see increasing debt, deteriorating interest coverage, or most importantly, deterioration in returns on assets and/or equity.
Table 5 is not telling a story of deterioration. Instead, it’s confirming common sense expectations about what we should see with a healthy acquiring program.
Obviously, there is going to be some slackening in the immediate wake of significant purchases. When companies acquire, they bear all the costs on day one, but it often takes time for the benefits of the combinations to be achieved. So the sort of bounciness we see in Table 5 is fine. What’s most important is that we’re not seeing steady worsening and after a year of insubstantial acquisition activity (fiscal 2017); we see that CACI, in the trailing 12 months (most of which comprise fiscal 2018 which ended June 30th), trended for the better. If it makes another big purchase in the coming year, some softening of the numbers is to be expected in the short term. But CACI’s track record allows us to assume it will progress further after the initial jolts, as it did in the past. Or at least we can so presume if the share price is reasonably valued (a bad price cancels all good things about a company).
Bottom line: The numbers we’re seeing are good and they are consistent with what we’d expect if CACI’s self portrayals is accurate.
Valuation and Conclusion
Table 6 shows that the stock is reasonably or attractively valued (depending on how much emphasis one wants to place on the forward P/E, the one using the estimate of the current year EPS).
Table 6
| CACI | Medians | |||
| Industry | Sector | S&P 500 | ||
| PE using TTM EPS | 15.12 | 25.52 | 32.66 | 22.25 |
| PE using Est CurYr EPS | 21.90 | 20.13 | 25.27 | 18.11 |
| Price/Sales | 1.00 | 1.86 | 3.06 | 2.68 |
| Ent. Val./Sales | 1.21 | 2.06 | 2.44 | 3.25 |
| Price/Free Cash Flow | 15.92 | 26.33 | 32.39 | 32.71 |
| Price/Book | 2.16 | 4.39 | 4.00 | 3.40 |
| Noise as % Mkt. Cap. * | 48.8 | 70.84 | 92.08 | 54.61 |
| * Click here further information about the concept of P=V+N (Price = Value + Noise) | ||||
I am not put off by the forward P/E. The comparison is not apples to apples and in a way that works against CACI. For CACI, the “forward” P/E is actually for the year that just ended (6/30/18). For most companies in the comparative groups, the”current” year reflects one that will end on 12/13/18. All the other ratios, meanwhile, show to CACI’s advantage.
My favorite ratio is one with which you may not be familiar: Noise and a percent of Market Cap. I’ve written about it before, but if you’re new to this, click here for a quick summary. For now, suffice it to say the amount of dreams, fluff, wishful thinking, optimism, etc. in CACI’s stock price (something that is rarely near zero) is extremely low compared to the sector median, pretty low compared to the industry median and even below the generic S&P 500 median. If you’re into the “margin of safety” about which gurus often gush, this suggests a pretty good one.
