PDF Version: P123 Strategy Design Topic 9 – Position Sizing – Weighting
On Portfolio123, the default position-weighting (% Portfolio Weighting) for simulations and live portfolios is equal. From there, unless you have a Buy or Sell rule that says otherwise, the weights of continuously-held positions will rise or fall based on market conditions until you eventually sell, and new positions will be equally weighted from available cash. Those who would like to set weights more strategically can do so using Formula Weighting. This Topic discusses strategic considerations around such choices, and conclude with an illustrative case study.

Why use a fancy weighting protocol?
The short answer is that you don’t have to use Formula Weighting: Portfolio123 users have done well with our traditional % of Portfolio protocol for a long time and can continue to do likewise indefinitely into the future.
But there are two very important benefits that can be achieved by going beyond that.
Liquidity
This consideration does not necessarily relate to an individual investor or trader working with personal portfolios. But liquidity can be a critical deal-breaker for professionals and others who invest large amounts.
Assume hypothetically, a two stock professional portfolio: Apple and the fictional Micro Enterprises with a market capitalization of $7 million. (I know it’s a weird example; pretend its an iconoclastic hedge fund.)
- If this would have been a $10,000 personal portfolio, it could have been equally weighted without blinking an eye.
- But if the total portfolio size if $10 million, that would pose a problem. A full stake in Apple could easily be bought. But getting a full $5 million position in Micro would likely require some SEC filings, the services of an investment banker, and probably a tender offer and all that sort of thing.
- So a $10 million portfolio holding just those two securities would really need to use market cap or some other kind of size-based weighting (with judiciously set boundaries lest the stake in Micro round to zero).
If you are dealing with personal portfolios, such liquidity-oriented considerations are not likely to be relevant (unless you’re among those who like to push against the limits on what you can trade at the lower end of the market). This does not, necessarily exclude you from using weighting based on market cap or some other size-related concept like EV, Assets, Revenues, etc. It does, however, mean you’d be doing so for a different sort of reason, namely strategic, or confidence-based weighting.
If liquidity is paramount, you will most likely be forced to do some sort of size-based weighting. The most popular such approach is market capitalization weighting. Or you can, of you wish, pick another metric (such as Company Sales) that is also likely to funnel the largest portions of capital to the largest most liquid issues.
Confidence
Let’s start with the most basic fact of weighting (aside from liquidity): It has to do with confidence. If you have perfect confidence in your ability to pick stocks, you need not think about weighting or even diversification. The only rational decision would be to invest 100% of your capital in your favorite asset.
Nobody does that because nobody has perfect confidence in anything.
If you have equal degrees of confidence (or fear) in all your positions, then equal weighting is the most logically proper way to allocate a portfolio. And that is very often a perfectly fine way to go.
Modern Portfolio Theory (MPT), about which much has been written lately, introduced a scientific approach to evaluating varying degrees of confidence. It boils everything down to expected return offset by expected risk (variation) of each security, and in the portfolio as a whole (1+1 does not necessarily equal 2; we introducing covariance-correlation, the degrees of risk each security has relative to others in the portfolio) and tries, with formulations that look like they came directly from Homer’s quill (math equations with lots of Greek terms), to come up with the best of all possible (“optimal”) weightings.
We don’t do MPT on Portfolio123. But it helps set a context for what we (and others) are trying to do with our weighting algorithms. It takes model building to step 2.
- Step 1 is an attempt to get an edge over a passive solution through the decisions we make to include some stocks and exclude all the rest. This alone can accomplish quite a lot, as many Portfolio123 users have experienced. So again, use of traditional % Portfolio Weighting is a perfectly fine choice.
- Step 2 takes it up to the next level by looking for ways to amplify our strategy by giving more weight to stocks in which we’re more confident.
So what sorts of things might justify higher levels of confidence?
Many assume bigger is better – and this is not as simplistic as it may seem at first glance.
The “better” is likely to manifest more on the risk side of the equation than in growth (the bigger the company, the harder it can be to post incremental growth; that’s life, not just in business but in everything). Bigger companies are better able to absorb fixed costs, thus making their bottom lines less volatile for a given degree of revenue fluctuation. Also, bigger firms are more likely to be better diversified in terms of in terms of business line and customer exposure. This is so even for firms we think of as operating in a single industry. (If you read enough 10-K business descriptions, you’ll likely gain an appreciation of how many different sets of activities can fall within the same GICS business classification.)
So it looks like we’re back where we started; right back to size-based weighting; same answer as before albeit for a different reason. Now, it’s about being better as opposed to just plain tradability.
But in fact, we haven’t just come around full circle. If we’re looking for better, or a basis in which we can have more confidence in some stocks than others, this raises new issues.
For one thing, we may want to re-evaluate how we defined bigger. As noted above, I reiterated market capitalization as the most popular approach and tossed out Sales weighting as an alternative. Now, however, the idea of Sales-based weighting requires mush greater thought. Is there a significant and sound reason to define size in terms of company sales rather than revenue? What about other potential size-related metrics such as cash flows, book values, etc. Must I pick only one, or can I pick a combination?
Detour: Smart Beta
Some of what you read in the above paragraph may seem familiar. This, actually, is what “Smart Beta” is all about. This is a label that’s being tossed about aggressively because the label sounds so good from a marketing standpoint. But much of what is described as smart beta really isn’t.
Smart Beta refers to a weighting protocol that is independent of changes in marketplace valuations. This is important because market-influenced weightings contain a built-in momentum tilt whether realized or not and whether desired or not. Here’s an example.
Table 1 illustrates a two-stock portfolio in which, at the start, both companies are identical in terms of market capitalization and revenue. Over the course of two months, one stock rises 10%. The other stays still. Watch what happens to the market-cap based portfolio weightings.
Table 1
| ABC | DEF | |
| Market Cap – day 1 | $500 mill. | $500 mill. |
| Sales – day 1 | $350 mill. | $350 mill. |
| Initial Portfolio Weight | 50% | 50% |
| 3 Mo. Share Price Change | +10% | 0% |
| New Market Cap | $550 mill. | $500 mill. |
| Sales on new date | $350 mill. | $350 mill. |
| New Portfolio Weight | 52.3% | 47.7% |
This adjustment doesn’t seem like much. But imagine a serious bull market in which many stocks make large movements over a prolonged period. That will have a double-barrel impact on the index. Stocks like ABC not only rise in value, but their weights get a roles within the portfolio get a second boost from the increases in weighting. This, by the way, played a major role in the way the market ran up so vigorously in the late 1990s even though anecdotally, we could see that many stocks weren’t participating all that fully in the party. The ones that did participate had double-barrel impacts on the capitalization-weighted market indexes. The same phenomenon influenced the speed with which the indexes plummeted later on.
Now, consider the same portfolio but with Sales-based (smart beta) weightings.
Table 2
| ABC | DEF | |
| Market Cap – day 1 | $500 mill. | $500 mill. |
| Sales – day 1 | $350 mill. | $350 mill. |
| Initial Portfolio Weight | 50% | 50% |
| 3 Mo. Share Price Change | +10% | 0% |
| New Market Cap | $550 mill. | $500 mill. |
| Sales on new date | $350 mill. | $350 mill. |
| New Portfolio Weight | 50% | 40% |
Both of these tables illustrate size-based weighting. But there’s a difference between the size of the company versus the size of the equity issue. Smart Beta defines size in terms of the former (and is sometimes called fundamental weighting).
Beyond Bigger is Better and Smart Beta
Does this mean you’re doing something wrong if you use a price-influenced weighting protocol? Absolutely not!
If you want to weight based on value, momentum, technical analysis, share volatility, etc., go for it. Just be prepared for some verbal push back if you promote the strategy in public and refer to it as smart beta. If you’re willing to shrug your shoulders and accept that the other guy is right, so be it (as noted, many out there already use the label for strategies to which it does not really apply).
Meanwhile, suppose you are more aggressive and want to lean more toward potential return than risk reduction. Size might again be relevant but this time in the opposite way. Now you might want to weight using a size-based ranking system but one in which ratings are based on an ascending (smaller is better) sort. And there’s no law against use of a volatility-based weighting formula framed in such a way as to overweight the more volatile stocks, or a value formula set up to overweight the overpriced stocks. If your personal risk tolerance can stomach it, then you can do it.
And as long as Pandora’s box has been pried open, you do a lot more. You can rank based on growth prospects, financial strength, analyst sentiment, valuation, . . . and in any combinations you wish. And remember the #Sector, #SubSector, #Industry and #SubIndustry parameters that are part of the Frank function; you can weight based on where a company stands, not relative to the universe as a whole, but relative to a peer group as you define it. So dial up the creativity and have at it.
At the end of the day, your other-than-liquidity-driven weighting formula can be based on whatever it is that causes you to have more confidence in some portfolio holding versus others.
Implications for Model Design
With simple % Portfolio Weighting, you approach model design with a four-pronged intellectual arsenal: (1) Buy Rules, (2) Ranking, (4) Refresh protocols, and (4) Sell Rules. Acronym: BRRS
.With Formula Weighting, you expand your arsenal to five: (1) Buy Rules, (2) Ranking, (3) Weighting, (4) Refresh protocols, and (5) Sell Rules. Expanded acronym: BRWRS
BRRS is easy (as strategy design goes) because you know going in you’ll have to use all four weapons, Buy, Rank, Refresh and Sell.
You don’t have that luxury when considering use of weights. You can go one of three ways:
- BRWRS (use all intellectual weapons in your arsenal)
- BRRS (you can go traditional without the fancy weights, but now, it’s a conscious choice, not the only available option)
- RWRS (eliminate Buy rules or limit yourself only to the most cursory Buy rules, and rely more heavily on weighting to contribute to alpha).
RWRS strategies are widely used in the professional arena. Traditionally, many institutional portfolios used S&P 500 mimicking as a starting point and then implemented active bullish or bearish judgments to overweight or underweight particular positons. So if a manager was especially bearish about XYZ, which was weighted 2.25 % in the S&P 500, that sentiment would be implemented not by eliminating XYZ but by underweighting it, say to 1.00%. And this, by the way, is why Buy-side folks hate it when Sell-side analysts say Sell. They know they can’t really sell to eliminate the position; liquidity concerns often compel institutions to use the S&P 500 or some other index as a starting point and find it difficult if not impossible to explain to clients why XYZ is still in the portfolio (albeit underweighted) even though it’s a dog.
Modern quant, factor and smart beta ETFs do essentially same thing, the difference being that they underweight or overweight based on objective rules rather than subjective judgement, and its why today’s active-versus-passive debate is so stale. Active investors say this sort of thing is passive. Passive investors say this sort of thing is active. I say who cares, it just is.
So now, you can do like the big time pros. You can pick a large group to own in its entirety and build an RWRS model, in which you implement your stock-picking skills through weights. And, by the way, if you ever dreamed of creating and licensing your own ETF and getting into the big time, go for it. You have as much RWRS capability as anybody out there. All you need now is the idea.
Note, though, that you don’t have to go big or go pro in order to benefit from RWRS. You can do it with personal-sized portfolios as well, although you will need at least some cursory set of buy rules to define a mini-market within which you’ll strategically weight. Let’s call this bRWRS (with a lower-case b).
Whatever choice you make, BRRS, BRWRS, RWRS, or bRWRS, it’s very important that your choice be a conscious decision. It’s OK to change your mind as you go along if you find your initial set of ideas isn’t quite working. But you really must, at all times, understand what kind of model you’re working on. This isn’t a Portfolio123 rule. It’s rule you should impose on yourself in order to guard against information overload and having your brain spin its way into a migraine.
Establishing a Weighting Formula
A weighting formula can be based on anything that is a legitimate strategic consideration as discussed in all the other Topics of this course. Everything you now know and everything you will learn in the future is on the table.
If you’re big believer in momentum or technical analysis, then use that as the basis for your formula. If excess cash generation is of interest to you, build a formula on the basis of that. Again, everything you know and everything you’ll learn in the future is available to you.
You can express something as a single factor, a single function, or a single formula. But if a single function, factor or formula doesn’t cut it, you can use a ranking system. In fact, if you look at the prospectuses of today’s nouvelle ETFs, you’ll find that’s what they are doing. They use scores as determined by multi-factor ranking systems as the basis for weighting.
So in deciding what to do strategically, I’ll borrow a well-used phrase you may have seen from the realm of legalese: Everything discussed in Topics 1-8 is “incorporated herein by reference.”
Beyond that, however, are some practicalities that are of special importance when those formulas are used for weighting. You won’t want to wind up wight any old set of numbers. You’ll want the formula’s output to consist of a sensible well-distributed set of numbers. Therefor, you should be especially sensitive to two sets of considerations.
- Guard Against Impractical Numbers (Outliers and Negative values)
Let’s assume you want to weight a 5-stock portfolio on the basis of the TTM EPS growth . Here are the basics:
Table 3
| Ticker | % Growth Rate |
| ABC | 8.5 |
| DEF | 3,745 |
| GHI | 16.2 |
| JKL | -5.1 |
| MNO | 9.7 |
The DEF 3,745% growth rate can easily be correct. Imagine a company whose EPS rises from a penny or two per share in one period, to a respectable profit in the equivalent period a year later. And we see negative growth rates all the time.
We could easily address these by setting minimum and maximum allowable weights. Indeed, the platform’s default to a zero minimum automatically knocks out negative numbers. So you can very easily get a rational and usable set of weights for this portfolio.
But would it be a good set of weights? Don’t assume something is worthy of using simply because it doesn’t lead to an Error message.
It’s possible DEF may, indeed, be the best stock and that it should get the highest weight. But how high should it go? Bear in mind the exact magnitude of the growth rate we see is likely the result of something odd, probably a write-off in the year-earlier period, and not something that is sustainable. Do we really want the weighting to reflect that?
And does it really make sense to zero out JKL? If you’re on the fence, let’s change the example to this:
Table 4
| Ticker | % Growth Rate |
| ABC | -43.6 |
| DEF | 3.2 |
| GHI | 16.2 |
| JKL | -5.1 |
| MNO | -9.7 |
Again, you can weight these without being flagged for an error message, but do you really want to do that. Why not have a growth oriented portfolio in which JKL is weighted more heavily than MNO, and much more heavily than ABC.
I suggest you be very careful about using any raw numbers or ratios as weighting factors. If I were working with either of these strategies, my weight factor would absolutely not be EPS%ChgTTM. Instead, I’d at the very least use Frank(“EPS%ChgTTM”). That would give each stock a positive weight and a distribution of weights that is probably more in line with the substance of my strategy.
And if that still leavers something to be desired (which is possible; some items produce really extreme distributions), you can work with the ZScore function, which expresses items in terms of how many standard deviations they are from the mean and allows you to trim outliers.
Use of raw numbers is best reserved for the tamest data sets such as MktCap, SalesTTM, and EV. And even these may not behave as well as we’d like if you apply them to a personal-sized portfolio, rather than a substantial RWRS model.
If you haven’t yet become proficient in use of Frank and ZScore, this would be a really good time to catch up on those functions.
- The Subtleties of using Ranking Systems
You can use the output of a ranking system (with rank scores calculated based on the universe being used in your model) as a basis for weighting. And as noted, this will often be a very good thing to do. In fact, if it becomes the only way you do it, that’s fine; you’ll be in really good company (i.e. the new breed of quant portfolio and ETF builders).
As you may already know, if you access a ranking system via the RANK function, you’ll be using the same ranking system that was used to pick the to 10, 15, 20, . . . ,N stocks that ultimately are put into the portfolio.
You can do this. But understand this will give you something very close to equal weighting at the outset, since your day one ranks are likely to be something along the lines of 99.42, 99.19,. 98.53, 97.12, 97.01, etc. For a low turnover portfolio, that may work quite well since it can be expected that the ranks will change over time so a year later, those same stocks may be ranked, say, 91.14, 74.36, 68.14, 62.12, 57.14 and 50.85. That means over the course of the year, you will have shifted money out of deteriorating positions into more solid ones. If you have a RANK<50 Sell rule, two of those stocks are clearly on probation and may get whacked in the near future. Is this a good thing to do? I don’t know. Test it and see.
The more mainstream approach would be to look for a better-disbursed distribution from day one. To do this, avoid repeating yourself by using RANK as a weighting formula. Use Rating() instead. This allows you to make use of a ranking system that differs from the one you’re using to sort stocks.
If the system you specify via Rating() is similar to the one specified via RANK (e.g., two Value-oriented rankling systems), you may find yourself back in the same boat. The best way to get Rating() to work well for you is to use it to introduce something genuinely new to the model. Perhaps you can get something like this.
Table 5
| Ticker | For Picking Top N Stocks | For Weighting |
| Value Rank | Growth Rank | |
| PQR | 99.14 | 75.22 |
| STU | 98.72 | 93.12 |
| VWX | 98.49 | 67.18 |
| YZA | 97.83 | 65.13 |
| BCD | 97.66 | 86.20 |
This is something that can make sense. We have a portfolio of stocks well ranked for value. We may have also had a Buy rule that limited our sorting only to stocks that passed certain quality-risk thresholds. We know growth is important too (Remember the dividend growth model and its extensions!), but are concerned about how hard it is to use historic growth rates. So maybe we give the softer growth data a softer spot in the model; rather than using them to include or exclude stocks, we use them to help us adjust the weightings of a group of stocks on which we’re already bullish.
Use of Weightings in the Context of the Overall Strategy
Let’s refresh ourselves for a moment on the overarching theme of strategy design, as discussed in the earlies Topics in this series. We started with the Dividend Discount Model and extended it to encompass other metrics such as earnings, sales, book value and cash flow. Ultimately, we’re seeking stocks that seem likely to be mispriced under the following broad framework:
P = D/(R – G), which can be generalize to . . .
P = W/((rf + RK(erp)) – G)
P = Ideal stock price
W = some measure of periodic wealth generated by the company
rf = the risk-free rate of return
RK = a measure of company specific risk
erp = equity-risk premium
G = the rate at which W is expected to grow in the future
We focus on W, RK, and G, the italicized items, the ones we can address in building our strategies. The others are external market factors with which we’re stuck.
We also know, based on the structure of the equation, that all else being equal:
As W rises, so, too, does P
As RK fall, P rises
As G rises, so, too, does P
Let’s now focus on the three primary tools we use to implement strategies that seek to exploit market inefficiencies in these area,
Ranking:We set up a criterion for classifying stocks from best to worst. If we do our work perfectly, the #1 stock will be better than the #2 stock; the #2 stock will be better than the #3 stock, etc., etc., etc. Ranking is not black-or-white; it involves shades of grey.
Screening/Buy Rules:We live in a highly imperfect world and, hence should expect our Ranking-system to be imperfect. So we try to give it some help, to tilt probabilities in a desirable direction, by limiting the rank-based sort to a subset of stocks that has been pre-qualified hopefully to be more likely to be successfully rank-able. Screening is black-or-white; pass-or-fail. There are no shades of grey.
So we see that Ranking and Buy rules each play a distinct role within the model. In that context, let’s now consider the role of weightings (again, assuming we use them for strategic purposes and not just to facilitate liquidity).
Weightings:Functionally speaking, this is a hybrid between Screening and Ranking. It resembles Screening in that it plays a role that supports our imperfect ranking systems and tries to nudge them toward a higher probability of successful sorting. It resembles ranking in that it deals with shades of grey, not black-or-white.
We approach weighting knowing that we need not do anything here if we have equal degrees of confidence or comfort with the output of what we’ve done with Ranking and Screening. We use Weighting if or when we decide that the world’s imperfections are enough to warrant an extra layer of help.
The extra help we get from the Weighting protocol need not be fanatically precise since we’ve already done a lot, via Screening and Ranking, to get to the final N number of stocks. The weighting protocol should not be used to try to fight with or even cancel the impact of what we accomplished with Screening and Ranking. That would be a move in the opposite direction from where we want to go (to increase the likelihood the ranking systems will have delivered good stocks to us).
Given the role of the weighting formula, as an extra layer of support, there are two approaches we can take:
- Use a formula that is consistent with the strategic ideas embodied in the Ranking systems and/or Buy rules. You might, for example, use RANK or Rating(“Value2”) or, perhaps (Frank(“PEGLT,#Sector,#Asc)” to weight a portfolio that uses “Value1” as its primary ranking system and, perhaps, a Quality-oriented screen to address the RK (risk) element of the strategy.
- Use a formula that adds something genuinely new to the model, something truly worth using but which you were unable to squeeze into Screen and Rank. Going back to the above Value1-Quality Screen model, you might use the weighting protocol to address the heretofore omitted G (growth) factor. You might weight based on a ranking system that uses a collection of historical growth rates, or you might use a ranking system built on the basis of sentiment or technical analysis (proxies for expectations of future growth), or even a more comprehensive GS (growth-sentiment) type of ranking system.
Being consciously aware of what you want your weighting protocol is important. It’s OK to change your mind after you get started and do some testing. But keeping the role you want weighting to play top of mind will help you avoid the information-overload spinning-in-place phenomenon. This framework is not intended to tell you what formula to use. It’s intended to illustrate how you can make a controlled thoughtful choice of formula.
Implications for the Refresh Cycle
Weekly rebalancing-reconstitution is a popular approach on Portfolio123. It’s fine to go that route if you’re checking often for adjustments that need to be made in a model built for few sells and low turnover. But it’s not necessarily OK to do that simply to take advantage of the freshest data you can get.
Businesses don’t develop and investors don’t evaluate them at anywhere near the speed with which contemporary systems can refresh information. It’s OK to trade weekly if your model is genuinely built upon a story you expect to play out or fizzle rapidly. More often than not, though, you’ll need more time to give your ideas time to take root.
I reiterate this here because when your strategy includes the additional layer of weightings, you may find you can give your models even more time to pan out. This won’t always be so. But if you do take advantage of Formula Weighting, make sure to run some tests using longer reconstitution periods than you have been accustomed to using, and experiment with reconstitution periods that are longer than the rebalance intervals.
When it comes to time horizon, don’t take anything for granted from your previous experience. Test and learn anew.
Implications for Target Number of Positions
The number of positions you want to hold in your portfolio is another area in which you should refrain from taking anything for granted and regarding which you should test and learn anew.
The boundary between having enough positions to overcome individual aberrations and give your ideas an opportunity to play out, versus having so many positions that you might just as well index, has always been a challenge to identify. As you search for this fuzzy line of demarcation, bear in mind that if use of formula weighting allows you to stretch the refresh cycles you had been using in the past, that could make it tolerable, from a trading cost perspective, to hold more positions than you previously had.
To the extent you can afford to take some extra wiggle room in this regard, consider doing it. For one thing, weighting is likely to be more effective if there are enough securities for the protocol to operate rationally (e.g., something that is not an 85%-15% thing) and make a difference. Also, it has been my observation that many on Portfolio123 who have exposed models to public view have tended to err on the side of too few stocks. Use of formula weighting would make for a good occasion to rethink this issue.
Case Study
For purposes of illustration, let’s work look at a case study that uses the following model as a starting point. Don’t look for us to ultimately get to something great, something in which you’ll want to invest real money. The goal, here, is to illustrate how Formula Weighting can impact what you do.
Universe:S&P 500
Benchmark:iShares SPDR S&P 500 ETF (SPY)
Targeted Number of Stocks:20
Refresh (Reconstitution and Rebalancing) Interval:3 Months
Ranking System:“Comprehensive: QVGM” (Quality-Value-Growth-Momentum”)
Buy Rules: Rating(Basic: Value”)>=75
Rating(Basic: Sentiment”)>=75
Sell Rules: Rating(Basic: Value”)<50
Rating(Basic: Sentiment”)<50
Rank<80
Results of 10-year simulations testing various weighting protocols are shown on the following pages.
Let’s start with the basics, the traditional protocol.
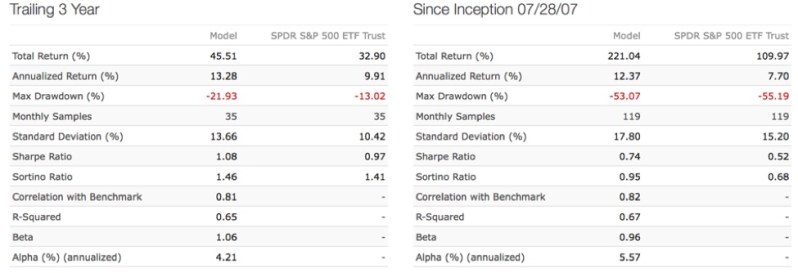
1stTest:Use % Position Weighting (traditional Portfolio123 protocol)


And now, let’s quickly turn to what many may regard as the default choice for formula weighting; use of market cap
2ndTestUsing Formula Weighting
Formula: MktCap
Minimum: off
Maximum:off


We actually gained something here, which comports with common sense since the time period tested, 7/28/07-7/28/17 was one in which larger-cap stocks tended to do better.
This test turns market cap upside down. It weights using a ranking system that looks at market cap but does so in ascending, smaller-is-better order.
3rdTestUsing Formula Weighting
Formula: Rating(“Reverse MktCap”) Rank factor: MktCap. Smaller is better
Minimum: off
Maximum:off


That’s not so hot. But recall, this test covered a period in which large cap was in.
We’re sticking with our smaller-is-better cap weighting scheme but now, the simulation dates are 1/2/99 – 7/28/07, a period during which small-caps were favored
4thTestUsing Formula Weighting
NOTE: Simulation 1/2/99 – 7/28/07
Formula: Rating(“Reverse MktCap”) Rank factor: MktCap. Smaller is better
Minimum: off
Maximum:off


That’s great, and it has major implications for strategy design. If you believe the so-called small-cap effect will be active during the upcoming period, and want to take advantage of it, here’s a way to do so while maintaining blue-chip like trading liquidity. Use a super-liquid universe, but weight based on smaller is better cap weighting.
Let’s try a very simple smart-beta approach; sales-based weighting.
5thTestUsing Formula Weighting
Formula: SalesTTM
Minimum: off
Maximum:off

Let’s see if we can weight successfully based on analyst sentiment (recommendation score); remember, 1 is most bullish and 5 is most bearish so the Frank sort has to be ascending.
6thTestUsing Formula Weighting
Formula: Frank(“AvgRec”,#all,#asc)
Minimum: off
Maximum:off


Z-z-z-z. That gives ammunition to critics who see analyst ratings as worthless.
Let’s switch it up and use a descending sort. This is a contrarian approach that gives strongest weights to stocks least favored by analysts.
7thTestUsing Formula Weighting
Formula: Frank(“AvgRec”,#all,#desc)
Minimum: off
Maximum:off

 So maybe analyst recommendations aren’t useless after all; maybe we just need to play reverse psychology with them.
The media and public love to see target prices. Let’s see if we can use those (projected gain from current to target price) as a basis for weighting.
8thTestUsing Formula Weighting
Formula: Frank(“PriceTargetMean/close(0)”,#all,#desc)
Minimum: off
Maximum:off


Now you know why I go against the grain and consider target prices to be the single worst data-point in the financial arsenal.
But bad data-points can be co-opted and used if you know why and how they’ll be bad. Here’s a weighting protocol that uses target prices in a contrarian way. It’s the same as above, but the sort is reversed and is now less-is-better.
9thTestUsing Formula Weighting
Formula: Frank(“PriceTargetMean/close(0)”,#all,#asc)
Minimum: off
Maximum:off


Gee, what a surprise (wink, wink).
Conclusion
Position sizing is a very powerful and important part of the stock strategist’s intellectual arsenal. Not only does it allow you to make further use of all the creativity you’ve called upon up till now as you decided what stocks to include and exclude from your portfolios, it also allows you to call upon those same creative processes without changing the roster of stocks. That can be of make-or-break importance if, for some reason, your portfolio must contain specific names. It also makes for much more relevant portfolio-benchmark comparisons, since we only have a small number of equally-weighted benchmarks. Finally, as with ranking systems, buy rules and sell rules, make sure you have a sound common sense reason for weighting as you do.
