PDF Version: P123 Strategy Design Topic 8 – Special – Hedging and Market Timing
This is another graduate topic that is being addressed pursuant to a well-conceived member request. Although many on Portfolio123 think of hedging and market timing together, in fact, they are opposites. Market timing refers to adjustments one makes in response to expectations that the market will change direction. Hedging refers to adjustment one makes in a portfolio to reduce risk in the face of a recognized inability to figure out where the market is going.

Market Timing
In principle, I love market timing.
Who in their right mind wouldn’t want a strategy that keeps you in stocks when the market is good and gets you out when the market turns sour. Better still, it’s so easy, almost embarrassingly easy, to dramatically boost the simulated results of any strategy (much higher return, much lower volatility, and dramatically reduced or even eliminated max drawdown).
Many, perhaps most, of the timing protocols in use on Portfolio123 relate one way or another to a system we introduced a while back in which bearish conditions are defined with respect to the relationship between a moving average of the consensus S&P 500 estimate and a longer moving average. Testing has repeatedly shown that this approach worked brilliantly during bear markets of the early 2000s and 2008.
Here’s the problem: It did not actually protect anybody from experiencing mega-drawdowns during those periods. That’s because the system was created after 2008. The first significant challenge experienced by the market after creation of the system occurred around mid-2011. The system completely failed.
This isn’t just one of those things, an instance in which no forecasting model can be expected to be 100% accurate. The 2011 failure was due to an inevitable and systemic problem, one that hasn’t and never will go away.
Simply put, things change. Not all bear markets are alike. They can occur for countless numbers of different reasons. The SP500 estimate model, designed with the benefit of 20-20 hindsight, effectively signaled one particular market challenge (weakening earnings expectations), and there is good reason to expect it will continue to signal future occurrences like that ahead of time. Given the inevitable relationship between stock prices and earnings, this timing protocol is definitely a keeper – as long as you understand its limitations.
You cannot assume this approach will protect you against bear markets in general. You would not be protected against headline driven drawdowns, as occurred in 2011. You would not be protected against interest-rate shocks. You would not be protected against earnings-related shocks if the market runs ahead of analysts and prices them in before estimates get revised. Etc., etc., etc. To truly protect yourself from major drawdowns, you would need a very complex comprehensive system, or a constellation of multiple simpler systems, and whatever protocol you use would need to be able to cope with the reality that for better or worse, major market movements are becoming increasingly concentrated in the decisions (human and/or algorithmic with increasing doses of the latter) of fewer and fewer larger and larger decision-makers.
I would never suggest it’s impossible for anyone to come up with something truly reliable. But it’s important to separate ego, desire and reality.
Market timing before the fact is much harder than it looks when one plugs a simple system designed with 20-20 hindsight into a simulation and watches the since-1999 results soar, and, I suspect, will require substantial use of economic data in addition to fundamentals and technical signals. You have to be prepared to pick up many different kinds of signals from many different kinds of sources.
The upshot: There’s nothing wrong with market timing if you can really do it. But there’s everything wrong with believing you’ve solved the market-timing puzzle if, in fact, you haven’t. Nothing can damage your portfolio more severely than complacency, and unwarranted faith in an overly limited timing model breeds that very thing. (Note, too, that among truly successful investors, none of them were market timers.)
All this said, I understand it’s tempting to believe one can solve the problem by relying exclusively or even heavily on internal market dynamics; i.e. technical analysis. Those who’ve worked this way know that many trending systems can, indeed, shelter you from adverse periods. But its not just a matter of having you pout. It’s a matter of how quickly you get out, how effectively the system times your re-entry, and the number of return-depressing false signals you get.
To evaluate such systems, you’ll need to d a lot of simulating to develop a feel for how much protection you get (the benefits of missing downturns) versus the cost you pay (missing re-entry points and false signals). Interestingly, though, this is the exact sort of test-evaluation process you’d go through with what may be a different and probably much more manageable approach to drawdown protection, hedging. With market timing, you can never rest comfortably knowing your system will continue to work in the future. No matter what happens, you must always fear the next big drop. With hedging, however, you know exactly what you’re getting.
Timing and hedging both require you to test, evaluated and make choices regarding the protection-versus-cost of protection tradeoff. In that sense, it’s a wash. But hedging has the advantage of allowing you to feel comfortable knowing that once you make your choice, you’ll get what you paying for going forward. So let’s turn, now, to hedging.
Hedging
If you could time the market, there would be no reason to hedge. If you are bullish, then you own securities (e.g. stocks) likely to benefit from a bullish environment. If you turn bearish, sell those investments and repurchase others (fixed income securities, cash, or short positions in equities) you deem more suited for adverse market conditions. Switch back when you turn bullish. Whatever your view, you are not hedging. You are always all-in based on your view of the market.
When you hedge, you are never all-in. A classic example of a hedge is when one wants to be long in stocks, but is uncertain as to whether this is the ideal strategy (which for most equity investors, is pretty much all the time). The investor isn’t so fearful as to sell everything and switch to bearish-oriented investments or confident in one’s ability to successfully do so. Instead, one “hedges” by purchasing one or more securities deemed likely to offset the risk-return characteristics of the main portfolio.
Think of hedging as a permanent strategy. In a Portfolio123 simulation/port, you would:
- Enable the “Hedge Mkt Timing” module
- Set an entry rule that would always be read as true, such as
- BenchClose(0) >=0
- Set an exit rule that would always be read as false, such as
- BenchClose(0)<0
Once you’d done that, all of your attention and effort will focus on two things: (i) the Hedge Vehicle, and (ii) the Hedge Ratio.
In working with these two choices, keep in mind what a hedge is and is not designed to do. It’s not magic. It’s not a free lunch that will make bear markets vanish. It’s a purchase of risk-reduction services, much the way insurance is elsewhere in life. And as is the case elsewhere, you must expect to pay for services received. With auto insurance, for example, you pay policy premiums in order to purchase the commitment of the insurance company to step in and pay all or a specified portion of losses you may sustain as a result of your ownership and operation of a vehicle.
In the market, you pay premiums for portfolio insurance. One simple and direct example would be the cost of purchasing a put option that will rise if the stock you hold falls in value. As with auto insurance if all goes well, you may wind up facing no losses and having seen the money you spent for protection vanish – you got piece of mind, but nothing tangible. Or, you may face losses and get tangible compensation. With auto insurance, it won’t necessarily be dollar for dollar (deductibles, insurable value, etc.). So, too, is the case with portfolio insurance. The gains on your put may compensate for, say, 25% of the losses on your stock. Or, you might pay more for options that provide greater coverage, options that wind up recouping 60% of your loss. As with other kinds of insurance the more you’re willing to pay, the greater the degree of protection you can receive.
That is the mind-set that should inform your decisions with hedging. You decide how much you’re willing to pay for what degree of protection. The only difference between Portfolio123 hedging and auto insurance is that the premium payments and the reimbursement are indirect.
- Instead of paying a specified insurance premium, you indirectly pay by sacrificing the opportunity to get as much in the way of gains as you could have gotten in an uninsured/un-hedged portfolio.
- Instead of being reimbursed based on a specific amount or formula, your reimbursement is the reduction in loss you realize on your hedged portfolio relative to what you would have experienced with an un-hedged portfolio.
Thus far on Portfolio123, hedging has not been a hot topic and when discussed it has often been erroneously lumped in with the separate market-timing topic. That’s because there has been little perceived need for it. Except for the well-known crash of 2008 and some other quick drops (e.g., a brief period in 2011), the market benefitted from a powerful Federal Reserve tailwind (i.e. plunging interest rates) which especially benefitted the lowest quality nano-cap many users pursued (it’s normal in times of surplus capital for money to wind up chasing the lowest quality assets as other, better, demands for capital get satiated).
Going forward, with that tailwind gone (best-case scenario) or reversing into a rising interest-rate headwind (worse scenario), and with the lowest-quality equities being most vulnerable to withdrawal of capital, Portfolio123 members (as well as others) may find more motivation to incorporate permanent hedging into their strategies.
The Hedge Vehicle
As is the case with health insurance, there exists a variety of plan types in portfolio insurance. Here’s a rundown on the menu of choices:
Cash
This substitutes a simulated zero-return zero volatility asset for the entire portion of your equity portfolio. But contrary to the case with market timing, (which is what the Cash vehicle best serves), there never a reason to use cash as a 100% hedge vehicle since we’re talking here about permanent portions of the portfolio. If you think 100% of cash, you presumably would not be here at all. So it’s not really practical to use cash as a vehicle in the context of a Portfolio123 model that incorporates a permanent hedge.
Near Cash
This is the iSharers Short Treasury Bond ETF (SHV), which, for all practical purposes, is the vehicle of choice when one wants to incorporate cash into a hedge strategy. At present, the rate is near zero (SHV’s yield is 0.09%). But that may change in the future.
Fixed Income ETFs
This is a valuable hedging technique (subject to my reservations about use of the traditional ETF structure at all for fixed income – see the descriptive material that accompanies my Guggenheim Bond Ladder Smart Alpha models).
What you expect from Fixed Income is a diminished return compensated for by a hopefully and probably much more diminished level of volatility. This tradeoff is likely to remain valid going forward.
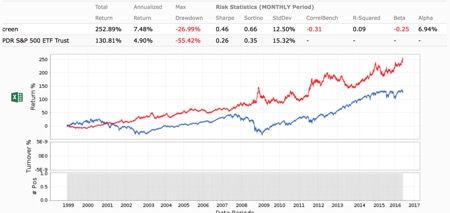
The most popular choice on Portfolio123 is TLT, the iShares 20+ Year Treasury Bond ETF. That’s easy to understand. Figure 1 shows the MAX backtest for a Ticker(“TLT”) ETF screen compared with an SPY benchmark. The annualized return is above that of SPY. Risk is lower. And TLT spikes especially upward in times of perceived or genuine crisis. It’s irresistible.
Figure 1 – TLT
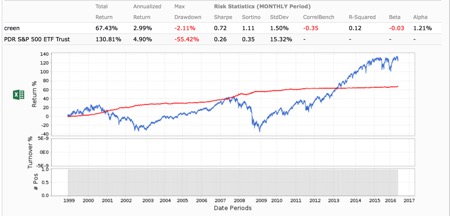
By way of comparison, Figure 2 shows test results for use of IEI (the 3-7 Year Treasury ETF) and Figure 3 shows test results for a screen based on SHY (the 1-3 year Treasury ETF).
Figure 2 – IEI
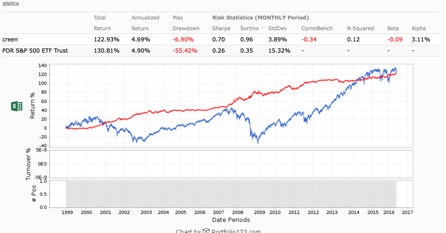
Figure 3 – SHY
I had been suggesting on the forums that Portfolio123 members cease using TLT as hedge vehicles because unlike with stocks, there is an absolute ceiling to the bond market, which is defined by zero interest rates (strictly speaking, the ceiling for TLT is an interest rate well above zero since the term structure of interest rates is such that this 20+ year portfolio would have to have a yield premium to the shortest-term securities which are the ones that are bounded by zero).
Recently, in a Portfolio123 thread, the following appeared:
Marc – I see things a bit differently.
Interest Rates:
– Back in the late 80’s I was thinking of buying a car. I told the used car salesman that I would probably hold off because interest rates were declining and I could probably get a better rate in the future. The salesman told me that rates were at a “historic low”and don’t expect lower rates ever.
– Early 2000’s I got a call from a broker who had the “trade of a lifetime”. Interest rates could not go any lower and it was time to take a position …
– Last year this guy named Gerstein started to say that holding TLT is crazy as there is a floor to interest rates …
Now, the contrarian view (my view) is that rates will continue to go lower and will likely go negative. The unfortunate part of Brexit is that Ms Yellen now has an excuse for why she was wrong about a strengthening economy. The truth is that the economy hasn’t been improving for some time and the Fed’s own indicators show this (see graph).
Let’s think about this.
Figure 4 shows the 10-year Treasury rate (the most recent level, at this writing, being 1.57%).
Figure 4
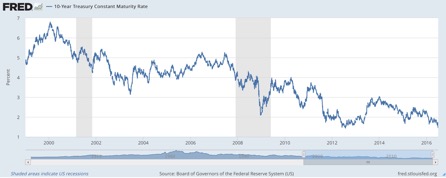
Bear in mind that the 10-year rate is not the rock bottom; it’s not the one bounded by zero.
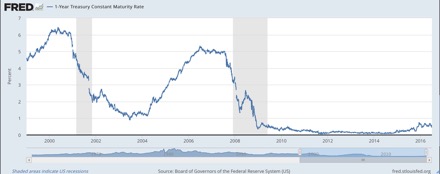
Figure 5 shows the 1-year rate, which at its present level of 0.56%, has already come up from the bottom.
Figure 5
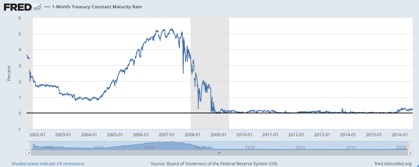
Even that isn’t the floor. Figure 6 shows the 1-month rate, which at 0.25%, is above its recent low.
Figure 6
Now, the term structure of interest rates does not absolutely require longer-term rates to always be lower than shorter rates. The opposite, an “inverted yield curve” can and does occur when economic weakness and diminished inflation forecasts are prevalent. But to say that we can have an inverted yield curve at this juncture in the rate cycle, or even a flattened one or negative interest rates (not modestly negative for a brief time, but substantially negative, like minus 5% for a period of many years; a scenario that would have to be implemented through a newly enacted “liquidity tax”), well . . . are these the kinds of things you want to analyze, discuss, debate and stick your neck out for when all you’re trying to do is hedge equity-market risk and when the only analytic tool available to many of you is the Portfolo123 1999-present simulation? Really? Is that where you want to go?
This is for you to decide. If you wish, as that forum poster apparently does, to stick with TLT, that is certainly your prerogative. But it is your responsibility – to yourself – to make sure you hold this position based on the substantial, bold and radical degree of financial and economic analysis that such a position would require, rather than on loyalty to simulations that have worked so well for so long.
Speaking for myself, assuming one wants to hedge with a fixed-income ETF, I cannot make a case for using TLT in lieu of IEI or SHY. There is a yield premium for TLT (2.38% versus 1.37% for IEI and 0.60% for SHY) but considering the drastic stretch in duration (the bond market’s answer to Beta) and the extreme sensitivity of face value to even modest changes in interest rates, I personally don’t think it makes sense to chase TLT’s yield, and that belief remains intact notwithstanding whatever microscopic down-squiggles the long rate can still take at present.
But that’s my opinion. You can disagree – but again and I can’t stress this enough, make sure you don’t do so based on simulation results and that you are comfortable with the monetary and macroeconomic assumptions you’ll need to make in order to justify your view.
Short ETFs
These are ETFs structured, using over-the-counter (i.e. privately negotiated rather than publicly traded) derivatives, to return the inverse of their stated equity or bond benchmarks.
OTC derivatives and OTC stocks are different animals. OTC stocks are typically seen as the province of the most adventurous and many say gullible individual investors. OTC derivatives are the opposite; they are limited to the most sophisticated pros. So don’t let the OTC nature of these derivatives scare you away from these ETFs. The more substantive concern is that they do involve counter-party risk. The ETF isn’t actually short anything. It’s long a set of derivatives and dependent on the issuer to pay up as required by market movements. Thus far, though, and even in 2008, this has not caused a problem. (Issuers don’t treat these as naked options; they expect to pay and do their own internal hedging.) Still, be aware counterparty risk exists.
These ETFs are structured around daily returns (i.e. if SPY falls 0.76% in a day, expect SH, the ProShares Short S&P 500 ETF, to rise 0.76% that same day, subject to minor variations for tracking error. During the worst of the 2008 crisis, there were some instances of tracking error enlarging for very brief times as the OTC derivatives huffed and puffed to keep pace with the rapid market movements), but on the whole, I’ve seen daily tracking error to be typically inconsequential and equally likely to be positive or negative.
Using these ETFs, you can establish short exposure to the equity or fixed income markets, and you can do so even in accounts that are long only (as far as your broker is concerned, you are taking long positions in routinely traded ETFs). And because these are long trades, you need not concern yourself with margin.
Leveraged ETFs
These are interesting and controversial securities. They multiply the magnitude of the targeted movement.
Assume, again, SPY falls 0.76% in a day. As noted, SH, should rise 0.76% subject to minor tracking error. But SDS, the ProShares Ultra Short S&P 500 ETF, targeted to double the daily movements, will rise 1.52%. Meanwhile, SPXU, targeted to triple the daily inverse movement of the S&P 500, will rise 2.28%.
There are also leveraged (2X and 3X) bull ETFs that amplify the movement in the same direction as the benchmark.
These leveraged ETFs, especially the ones that assume short exposure, are more tempting than strawberry cheese cake with hot fudge and whipped cream. You can get a lot of movement with just a little bit of capital, and do so without having to cope with the baggage of margin and/or shorting. Little wonder, then, that this family of products has been incredibly successful.
But, but, but, but, but . . . but be aware of the implications of daily targeting. If you hold these for an extended period of time (anything more than a day, actually), your actual return will likely differ, possibly by a very large amount, from the point-to-point beginning-to-end return of the benchmark even after adjusting for shorting and the leverage multiplier. The daily re-sets mean the realized point-to-point returns will be “path dependent.” This trait generated a lot of controversy when these products came out. Here was my take back in 2009:
Essentially, you need to anticipate that path dependency will give leveraged ETFs their own unique personality, rather than keeping them bound to naive expectations based on the benchmark. If you are going to use a leveraged ETF as part of a permanent hedge, especially a short product, you will have to rebalance often so you are constantly averaging your purchase price up and down. The last thing in the world you should dare do with a leveraged short ETF is buy-and-hold. Given the market’s normal long-term upward bias (from population growth, and productivity, etc.), such a course of action will get your position ever closer to zero without actually getting there (analogous to the half life concept in physics – you’ll continually approach, but not actually reach, zero). Frequent rebalancing, and readjustment of your average purchase price, is essential to protect yourself from the long-term half-life wipeout.
The benefit of hedging with leveraged ETFs is that you can get a lot of protection with only minimal commitment of capital to the hedge. But because their trading characteristics are so unique, I My recommend that you refrain from using them to hedge real-money portfolios until you’ve had a substantial opportunity to observe them in action, out of sample, in a paper portfolio.
Other Hedge Vehicles
The interface offers basic long equity ETFs and indexes among hedge vehicles. The latter can often be implemented through sector ETFs.
Consider these for specialty use only, such as a high-risk micro-cap strategy whose volatility is hedged with a small stake in a large-cap equity ETF, or a tech-cyclical ETF hedged with a small position in a less-volatile consumer staples ETF.
The Portfolio123 simulation will be imprecise. The ETFs you find may be imperfect matches for the indexes. But that’s OK. Simulation is never a perfect representation of anything, since past performance doesn’t assure future outcomes (you knew that; wink, wink). So don’t be shy about an imperfect proxy for a hedge vehicle. The only precision you’d be sacrificing is precision you never really had anyway.
The Hedge Ratio
This is the percent of assets you’ll dedicate to the hedge vehicle.
In market timing, users tend to think of 100% or zero. Hedging doesn’t work that way because it is, essentially, a permanent feature of the strategy.
This, essentially, is the equivalent of how much you’ll pay for health insurance and how big a deductible you’re wiling to tolerate. The larger your hedge percentage, the more insurance you get (the protection against volatility) but the higher the premium you pay (the more upside you forfeit).
You’ll need a lot of trial-and-error simulation to get a sense of what will work for you.
As Aside: Long-Short Market-Neutral
Another hedge-like thing you can do is go long the highest ranked stocks based on the system of your choice and short the lowest ranked stocks. (You can also use long and short screening rules).
This is not a hedge per se. It’s a market-neutral strategy.
It’s not a hedge because you are not reducing your systematic risk. Instead, you’re redefining it.
For example, if you use a Value ranking system as the basis for a long-short strategy, you have succeeded in removing the market direction from your results. But you have full exposure to the efficacy of your chosen definition of value and the market’s willingness to react to it. If you’ve chosen well, your portfolio will do well even if the overall market does badly. Conversely, if you’ve chosen poorly, your portfolio will suffer even in a bull market.
Implementing a Hedging Strategy
It’s convenient and useful to test and evaluate a hedge strategy in the context of the Portfolio123 simulation platform. That will go a long way toward helping us understand the protection-cost tradeoffs involved in the many combinations of choices we can make with regard to hedge vehicle and hedge ratio.
If one is investing all of one’s equity in one model, no big deal – build the hedge into he model and when satisfied, go live. But many of us don’t go this route. Many of us divide our equity among multiple strategies. Yet however many strategies we have, there’s only one thing against which we’re seeking protection – the market. And there’s only one investor with one set of risk tolerances and one set of protection-cost tradeoff preferences – ourselves. So for the most part, it really doesn’t make sense to go live with multiple hedges in multiple models.
It is likely to be much more manageable to develop hedge ideas as part of one’s general model building but when going live, to disable the hedges in the portfolio interface and implement via the Portfolio123 Book. To do this, you would set up a sim/portfolio called “Hedge” or something like that; it would have a dummy ranking system, a single position, a single ticker-based buy rule (the ticker being that of your chosen hedge vehicle) and a dummy sell rule such as Rank>101. Implement the hedge ratio through the book allocation thinking of it as a percent of all your equity assets.
If you have multiple specialized models (e.g., one that is very much generated toward a Russell2000 benchmark) and others aimed at the SP 500, you could justify multiple hedges. Just be aware of how easy it can be to slide down the slippery slope that leads to curve fitting or data mining. Make sure you are not enabling the hedge tabs simply to “improve” simulation results. Recognize, instead, that you are doing it to learn the implications of different cost-protection choices in anticipation of the unknown future.
