PDF Version: P123 Strategy Design Topic 4B – The DuPont Framework
When investors think about gurus, names that typically come to mind include Ben Graham, David Dodd, William Sharpe, Harry Markowitz, Warren Buffett, etc. Usually, we look for wisdom to academia and/or practice. Actually, though, we need to expand the scope – into Corporate America no less, particularly with DuPont.
A Common Problem
Investors and companies both know full well that Return on Equity (ROE) is the penultimate measure of what makes a company “good.” Yet both encounter real-world experiences in which companies with higher ROEs are found, for one reason or another, to have been less desirable than others with that posted lower returns.
Figure 1 illustrates the problem from our point of view. It’s a Max performance test of a single-factor ranking system based on ROE%TTM and run on the PRussell3000 Universe.
Figure 1

We see that in a very big-picture sense, high TTM ROE is better than low-TTM ROE, but not cleanly enough to allow that to make for an investing strategy.
Maybe the problem stems from use of TTM. Perhaps this ratio leaves us too vulnerable to non-recurring oddities. So let’s switch to ROE%5YAvg.
Figure 2

Scratch that idea.
Clearly, however important we know ROE to be, we can’t naively assume each company is better than all those with lower ROEs or worse than those with higher returns. Corporation encountered similar problems. They noticed that allocating more new capital to divisions with higher ROEs did not automatically produce better company-wide tallies.
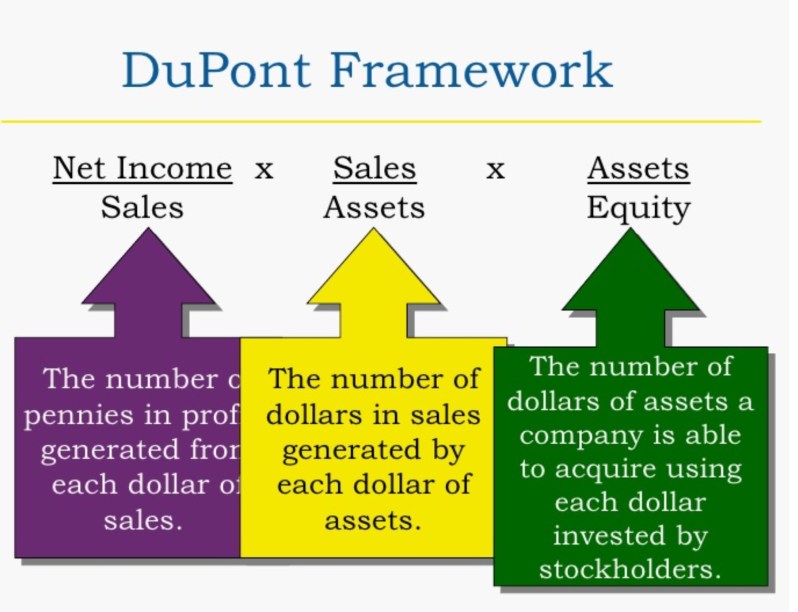
In the 1920s, DuPont came up with an analytic framework that gave it better visibility into the inner workings of ROE. By focusing on the components of ROE, rather than ROE itself, DuPont was better able to see when ROE was high for the wrong reasons and/or lower for understandable and acceptable reasons. The framework they developed is illustrated in Figure 3.
Figure 3 
It tells us that:
- Return on Equity is a function of Return on Assets and Leverage
- Return on Assets is a function of Margin and Turnover
Therefore,
- Return on Equity is a function of Margin, Turnover and Leverage
Mathematically, we can express it thusly:
- ROE = Net Margin * Asset Turnover * Financial Leverage
- ROE = (Net Income / Sales) * Asset Turnover * Financial Leverage
- ROE = (Net Income / Sales) * (Sales / Assets) * Financial Leverage
- ROE = (Net Income / Sales) * (Sales / Assets) * (Assets / Equity)
Practical Caveat
It may be tempting for some to use these formulas to try to recreate ROE and ROA. If you do that, don’t be surprised if you find that the returns you compute do not match those in the Portfolio123 database. Aside from the usual potential issues involving which quarters are being referenced and whether fallback is happening, there are many way to define each item in terms of what specifics are included or omitted.
For our purposes, as investment strategists, we’re interested in understanding the relationships in order help us get the benefit of favorable ROE metrics (which we may or may not openly specify in our models). So, for example, just because the traditional DuPont framework makes reference to Net Margin, don’t let that discourage you from using, say gross or operating margin if you think trends there will point a better picture of the way margin is likely to influence overall profitability (i.e. operating margin influences net margin which influences ROE). Ditto with how we approach leverage and turnover. It’s about relationships, not an audit trail.
And speaking of relationships, we don’t have to stop at margin, turnover and leverage. We can also incorporate into our models other data-points that illuminate the DuPont measures.
Figure 4 is a roadmap that shows how fundamental data and ratios work together starting with detailed reported items, up to margin, turnover and leverage, and up to returns on assets and equity and further up to “g,” the growth figure in valuation models and ultimately back to valuation itself. In early Topics, I spoke of how everything we do needs to relate logically, even if indirectly, to the Dividend Discount Model (DDM). Figure 4 should help you see how that can play out when as we deep dive into data items and ratios that don’t address value per se.
Figure 4

Game Plan
Figure 4 might strike some as intimidating given the way it can be seen as suggesting that a good model should work with . . . everything, or close to everything. It gets a lot more manageable if we remember why we’re dealing with this.
We’re looking one way or another, for a measure of quality and we know that higher ROE is the goal. But higher ROE, like lower PE and many other things, only works all else being equal. That puts us back in familiar territory: Our success or lack thereof will be cased by how effectively we handle the infamous “all else.”
For quality, the “all else” consists of one thing: the trend in ROE.
- Stable ROE is good.
- Rising ROE can be very good (assuming the stock hasn’t already run up to reflect that).
- Falling ROE is bad (but we can get away with it if the stock has gone too far in discounting the degree of bad).
- Volatile ROE is, well, maybe good and maybe bad but definitely riskier meaning we should react to it however we choose to react to riskier situations.
The common theme here is the trend. Anything we do in our models that helps point us toward the trends we prefer and/or away from trends we want to avoid is worth doing.
- One way to tease out a trend is to analyze ROE itself
- The other way, as suggested by DuPont is to analyze trends in the relevant components of ROE – and as suggested by Figure 4,we may or may not, as we choose, drill further down and analyze one or more divers of margin, turnover and/or leverage.
In the next topic (4C), we’ll look more closely at returns, margins, turnover and leverage and consider their respective pros and cons. After that (Topic 4D), we’ll experiment with some modeling and talk about the Piotroski F-Score, Buffett and Greenblatt, all of which by then should have different and more substantial meanings for you. Then, we’ll wrap up quality with consideration of a more specialized and potentially fertile-with-alpha sub-topic, earnings quality.
